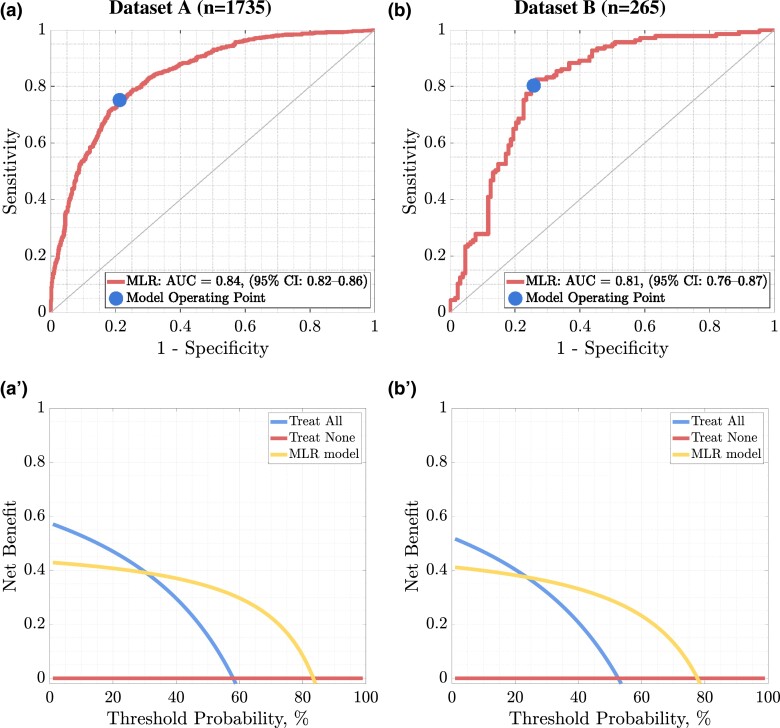
Figure 2.
The ROC curve (a) together with the DCA (a′) determined for the results of the MLR model fitted to the 8 selected features for dataset a, while the ROC (b) and the DCA (b′) curves were obtained for dataset b. The 45° curve through the origin in the case of the ROC curve shows the discriminant ability of the classifier no better than random selection.

