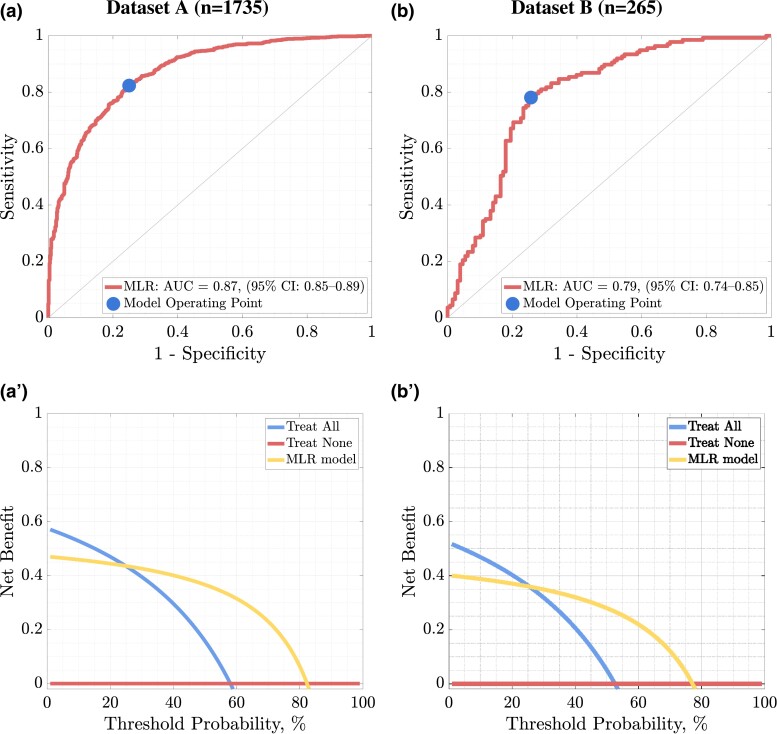
Figure 3.
The ROC curve (a) together with the DCA (a′) determined for the results of the MLR model fitted to all (80) features for dataset a, while the ROC (b) and the DCA (b′) curves were obtained for dataset b. The 45° curve through the origin in the case of the ROC curve shows the discriminant ability of the classifier no better than random selection.

