
Figure 4.
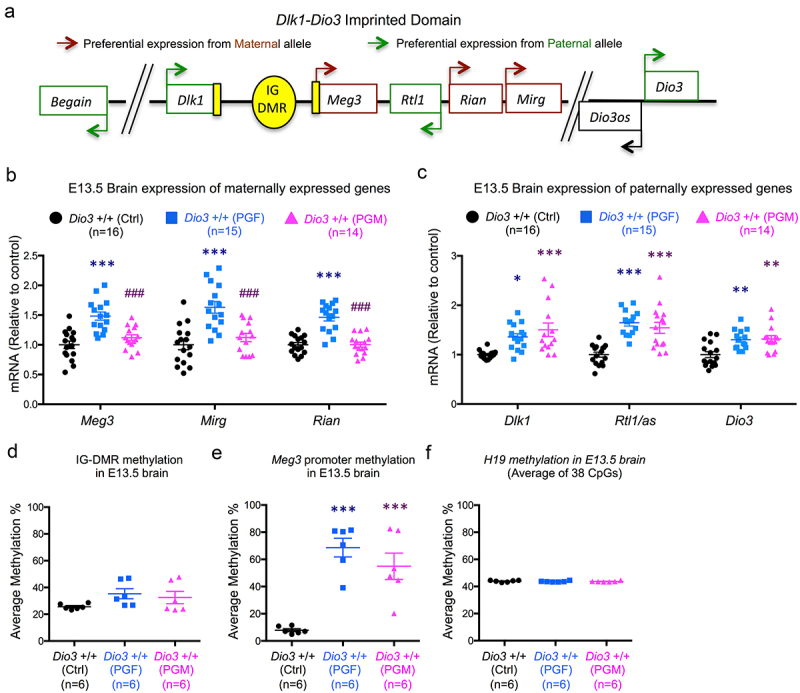
Gene expression and DNA methylation in F3 generation foetal brain.
(a), Simplified diagram of the genes analysed within the Dlk1-Dio3 imprinted domain indicating preferential maternal (brown arrows) or paternal (green arrows) expression. Shown genomic spacers represent approximately 320 and 650 kB, respectively. Shaded in yellow are regions differentially methylated between alleles, including the regulatory regions in the Meg 3 promoter and the intergenic differentially methylated region (IG-DMR). (b and c), Gene expression of maternal (b) and paternally expressed (c) genes in E13.5 brains of PGF and PGM mice. (d, e and f), Methylation status of 29 CpGs in the IG-DMR (d), 7 CpGs of the Meg3 promoter (e) and 40 CpGs in the H19 gene (f) in PGF and PGM E13.5 brains. Data represent the mean ± SEM of the indicated number of animals from at least three different litters. *, ** and *** indicate p < 0.05, 0.01 and 0.001, respectively, when compared to controls; and ### indicate p < 0.001 when compared to PGF, as determined by one-way ANOVA and Tukey’s post hoc test.