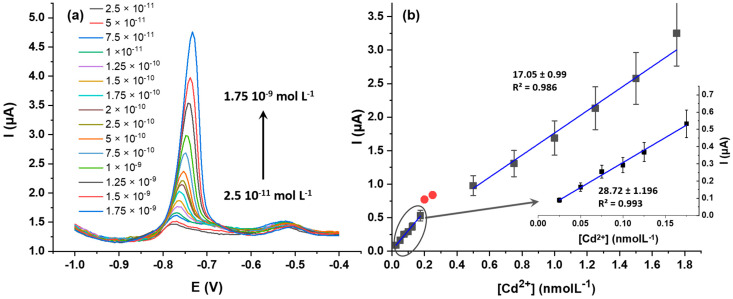
Figure 8.
(a) Differential pulse voltammograms for Cd2+ at varying concentrations using a ZnO@SiO2/GCE electrode in 0.1 molL−1 ABS buffer pH 5) and (b) calibration curves for Cd2+ detection on ZnO@SiO2/GCE electrodes. The concentration range between 0.2 and 0.5 nmolL−1 (red points) are not be considered due to the change in the electrochemical Cd2+ oxidation process.

