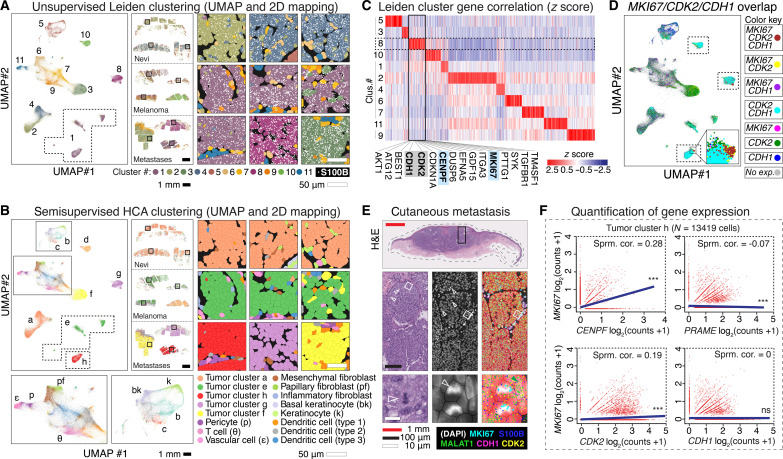
Fig. 2. Clustering analyses identify a proliferative gene signature that includes CDK2.
(A) UMAP projection of 203,472 cells into 11 unsupervised Leiden clusters, 2D mapped onto the nevi, melanoma, and cutaneous metastases samples. Black square insets magnified in right panels, showing portions of melanocytic tumors expressing S100B (white dots). (B) UMAP and 2D mapping with semisupervised clusters using HCA skin reference (solid rectangles magnified below). Black square insets magnified in right panels. (C) Heatmap of normalized gene expression in Leiden clusters. Proliferative markers MKI67 and CENPF localized to cluster 8, which also included melanoma-associated proliferative genes CDK2 and CDH1 (top hits listed below cluster in alphabetical order). (D) UMAP projection with combinatorial overlap of MKI67-, CDK2-, and CDH1-expressing cells; inset shows a portion of cluster h enriched for MKI67, CDK2, and CDH1 coexpression. (E) H&E and RNA-SMI of MKI67, CDK2, CDH1, S100B, and predominately nuclear localized MALAT1 within cutaneous metastasis #1 (predominately composed of tumor cluster h–type cells). Black solid rectangle is magnified in the middle horizontal row; white solid squares magnified in the bottom horizontal row. White open arrows point to mitoses. Green arrow shows predominately nuclear localization of MALAT1. The middle column DAPI panels are overlayed in the right column with semisupervised HCA cell clusters, most of which are tumor cluster h, as shown in (B). Detected RNA transcripts are shown as outlined in the key at bottom right key. Collectively, the panels show expression of MKI67, CDK2, and CDH1 in cells of the mitotically active portion of the tumor. (F) Gene expression correlation of tumor cluster h, showing a positive Spearman correlation (Sprm. cor.) of CENPF and CDK2 with MKI67 (correlation absent with PRAME and CDH1). ***, adjusted P value < 0.0001; ns, P value > 0.05.

