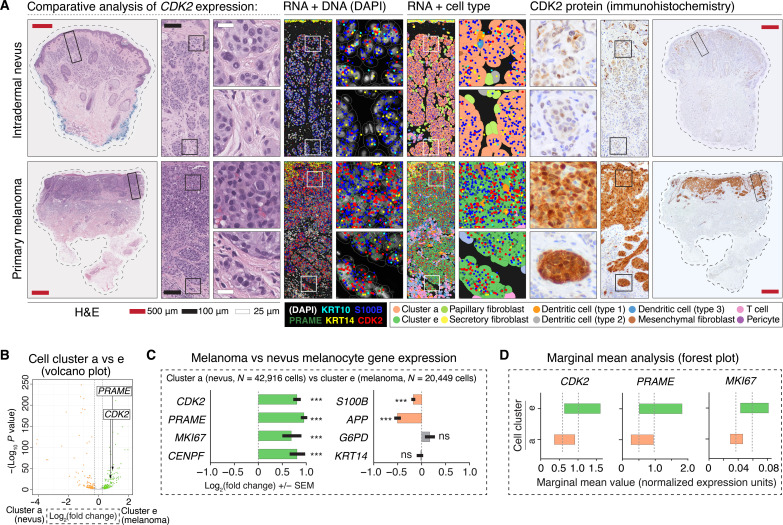
Fig. 3. Candidate gene analysis reveals differential tumor-stroma boundary expression of CDK2.
(A) Panels show the comparative loss of CDK2 expression in dermal melanocytes of intradermal nevi versus retained expression of CDK2 in dermally invasive primary melanoma. Left H&E panels have solid rectangular insets subsequently magnified in the rightward panels. H&E stains show characteristic, bland appearing nested melanocytes of an intradermal nevus versus the hyperchromatic, crowded, and pleomorphic cells of primary melanoma. RNA + DNA panels show comparatively increased expression of CDK2 and PRAME in S100B-expressing malignant melanoma melanocytes. RNA + cell type panels show semisupervised HCA clustering of the cells of the tumor, with annotation of intradermal nevus-like melanocytes (cluster a) and malignant melanoma melanocytes (cluster e). Right panels show CDK2 protein expression, which was notable for comparatively increased expression at the deep, tumor-stroma border in malignant melanoma versus nevus. (B) Volcano plot showing quantification of differential gene expression between nevus (cluster a) and melanoma (cluster e) melanocytes. Each dot on this plot represents a gene. The location of PRAME and CDK2 within the plot is shown. Orange dots represent genes with higher expression in nevus (cluster a), whereas green dots represent genes with higher expression in melanoma (cluster e). Gray dots represent genes that failed to reach the FDR threshold of 0.05 (Benjamini-Hochberg correction). (C) Bar graphs highlighting select genes from volcano plot shown in (B). ***P value < 0.0001; ns, P value > 0.05. Error bars show SEM. (D) Forest plots showing marginal means (gray dashed line) with a 95% confidence interval. Note that graphics shown in (B) to (D) are different ways to visualize the same quantification of differential expression of PRAME, CDK2, MKI67, and other genes between clusters a and e.

