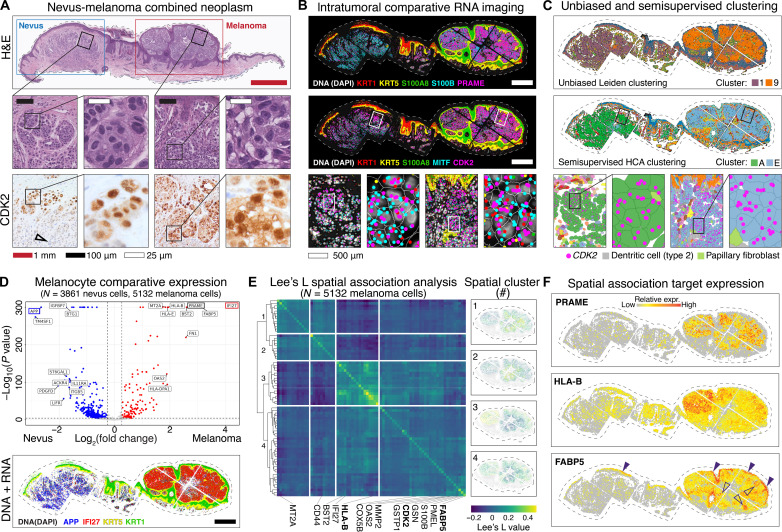
Fig. 4. Intratumoral spatial analyses reconcile field-level proliferative and metabolic gene expression signatures.
(A) Melanocytic tumor with nevus and malignant melanoma portions, with insets shown as indicated by black squares. Bottom row shows nuclear and cytoplasmic CDK2 protein expression in melanocytes. Black open arrow shows loss of CDK2 expression in deep nevus cells. (B) Top panel shows comparatively increased PRAME and S100A8 in melanoma portion of the tumor. The middle panel shows expression of CDK2 and melanocytic marker MITF, progressively magnified as indicated with white bordered rectangular insets. (C) Unsupervised Leiden (top) and semisupervised HCA (middle) clustering generated nevus-type and melanoma-type melanocyte clusters (clusters A and E, respectively). (D) Top panel shows volcano plot of differential gene expression between nevus (cluster A) and melanoma (cluster E) melanocytes. Blue dots represent genes with higher expression in nevus (cluster A), whereas red dots represent genes with higher expression in melanoma (cluster E). Gray dots represent genes that failed to reach the FDR threshold of 0.05 (Benjamini-Hochberg correction). The top hit in each condition outlined in blue (APP) or red (IFI27) were mapped out in the bottom DNA + RNA imaging panel. Scale bar: 500 μm. (E) Heatmap shows results of Lee’s L spatial association analysis of malignant melanocytes (cluster E), with each row and column representing a spatially patterned gene. Genes clustered into four hierarchical fields as numbered on the left. This spatial analysis used a combination of proximity and differential expression level to define four distinct fields of gene expression within the melanoma. The panels on the right show the normalized expression of all genes in each numbered field. (F) Spatial plots showing relative expression of known gene PRAME as well as immunoregulatory gene HLA-B and metabolic genes FABP5, which spatially clustered with CDK2 [field 4 in (E)].

