Figure 2.

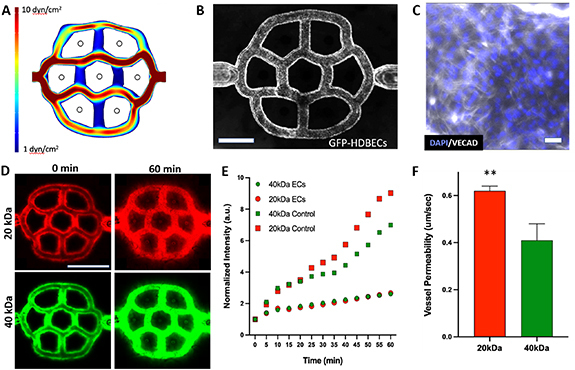
Characterization of the vascular plexus in 3D-SoC. (A) The COMSOL model displays the calculated range of shear stresses in the vascular pattern. The design recapitulates the physiological range of shear stress levels found in the cutaneous capillaries, venules, and arterioles. We divide the vasculature into three shear rate zones as low-shear (vertical interconnecting channels), mid-shear (two outermost channels, top and bottom) and high-shear (two innermost, horizontal channels). (B) Imaging of the vascular network seeded with GFP-HDBECs confirms uniform coverage of the microchannel walls. Scale bar: 1 mm; (C) Immunofluorescent staining of primary HDBECs in 3D-SoC with VE-cadherin (VECAD; white). Scale bar: 5 µm; (D) confocal imaging of the 3D-SoC seeded with HDBECs perfused with both 20 kDa and 40 kDa dextran at time zero and sixty minutes allowing for comparison of the permeability characteristics. Scale bar: 2 mm; (E) the graph shows increased leakage of dextran in the model without HDBECs (acellular control) for both molecular weights. (F) Time-lapse transport data integrated into a COMSOL model enabled the estimation of the average permeability of the vasculature. The permeability values were determined to be 0.62 µm s−1 for 20 kDa and 0.41 µm s−1 for 40 kDa respectively (** = p < 0.01).
