Figure 4.

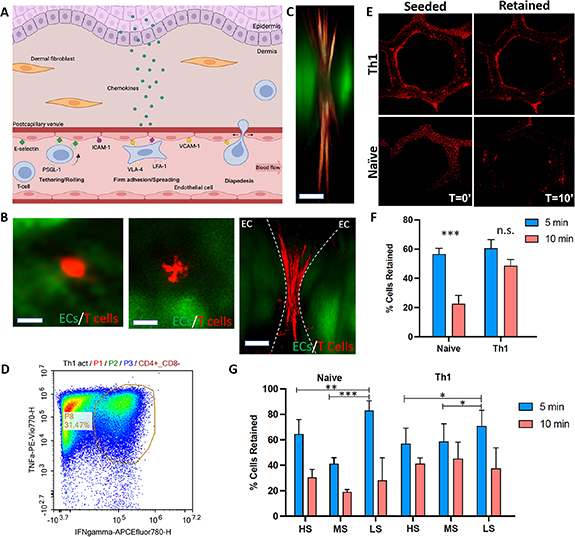
Incorporation and real-time monitoring of circulating T cells in 3D-SoC. (A) Schematic representation of the stages of T cell infiltration into human skin. (B) Live immunofluorescent images showing the naïve T cells labelled with CellTracker (red) on HDBECs in the first 1–2 min (left panel; the round morphology resembles the tethering/rolling stage); between 2–5 min (middle panel; the spread morphology resembles the firm adhesion stage); and between 5–15 min (right panel; the morphology and location relative to ECs resembles the diapedesis stage). The first two images show the top view, and the right-most image shows a cross-section of the 3D-SoC. Scale bars: 5 µm; (C) High magnification image capturing a T cell (red) with its lamellipodia squeezing between two endothelial cells (green), resembling the morphology of T cells in vivo during their movement through capillary walls (namely diapedesis). Scale bar: 2 µm; (D) characterization of Th1 cells polarized from Naïve T cells in vitro through flow cytometry showing expression of both Interferon γ and TNFα. (E) Comparison of the attachment of the T cells to the shear stress analysis for naive and Th1 cell population. (F) Total percentage of naïve T cells and Th1 cells retained after 5 and 10 mins of flow. (G) Percentage of cells retained for distinct shear zones; HS: high-shear, MS: mid-shear, LS: low-shear. (* = p < 0.05, ** = p < 0.01, *** = p < 0.005).
