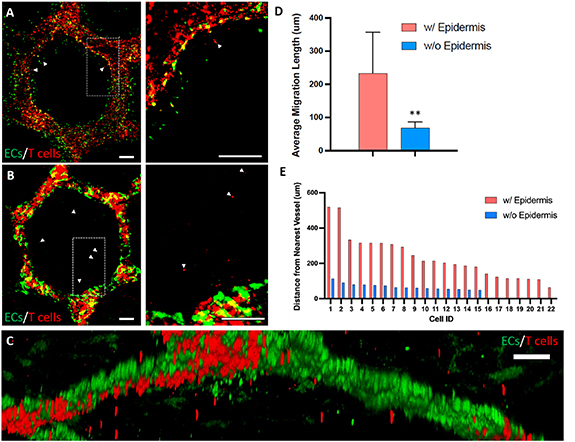
Figure 5.

Effect of the epidermis on Th1 cell infiltration into the dermal compartment. The infiltrated Th1 cells (labeled with CellTracker red) 5 d after their introduction into 3D-SoC without epidermis (A) and with epidermis (B). Arrow heads point to infiltrated Th1 cells; right panels show the zoomed in image of the dashed windows shown on the left panels. (C) 3D reconstructed high-magnification image showing the transmigration of Th1 cells in 3D-SoC with the epidermis. (D) Average migration length for T-cells in the presence and absence of epidermis (** = p < 0.01). (E) The distance of each infiltrated Th1 cell from the nearest vessel in the presence and absence of epidermis. Scale bars: 250 µm.
