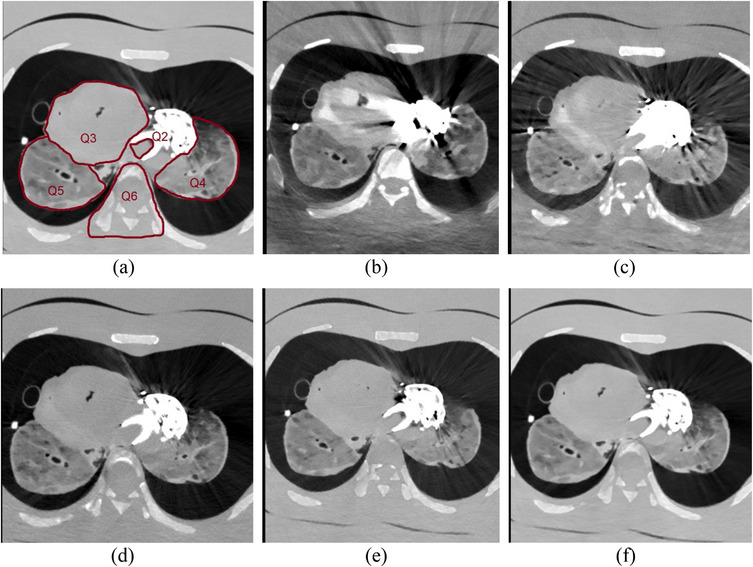
FIGURE 3.

(a) Shows the areas where diagnostic interpretability was evaluated, Q2: in the lumen of the LVAD inflow cannula, Q3: the cardiac tissue, Q4: left lung tissue, Q5: right lung tissue and Q6: the spinal cord and surrounding tissue. (b–f), shows images with a variety of metal artifacts. (b) massive artefacts, (c) pronounced streaks, (d) minor streaks, (e) minor streaks only at the thickest portions of the metallic implant, (f) indicates the absence of artefacts.
