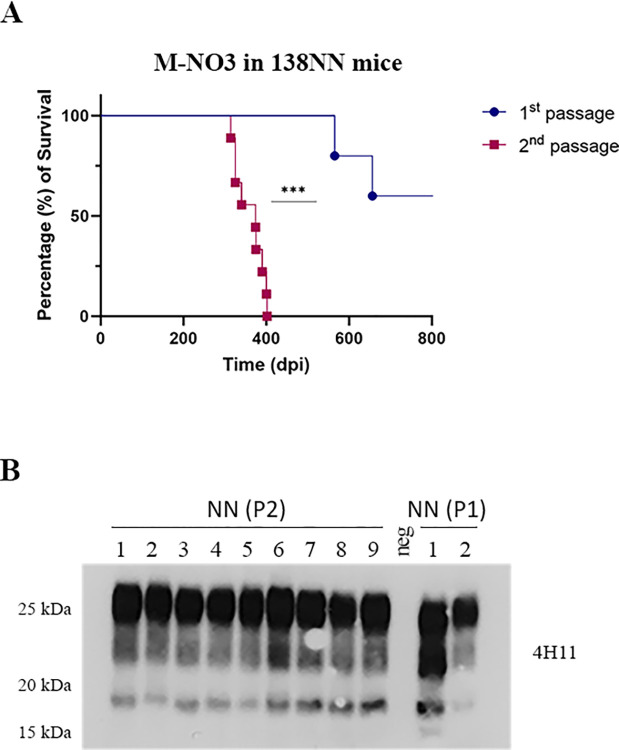
Fig 4. Second passage of M-NO3 in Prnp.Cer.138NN mouse model.
(A) Comparison of survival times of Prnp.Cer.138NN inoculated with M-NO3 (1st passage; n = 5; attack rate = 40%; see Table 1). Equal volumes of 10% brain homogenates of two mice with terminal prion disease in the 1st passage were pooled and used for the 2nd passage using a group of n = 9 Prnp.Cer.138NN mice for i.c. inoculation. Survival times are depicted as Kaplan-Meyer curve, and the log-rank test was used for statistical analysis. *** p-value = 0.0006. (B) Brain homogenates of 1st and 2nd passage were digested with 50 μg/ml of PK and subjected to western blot using anti-PrP antibody 4H11 (1:500), and 12B2 (Fig D in S1 Text).

