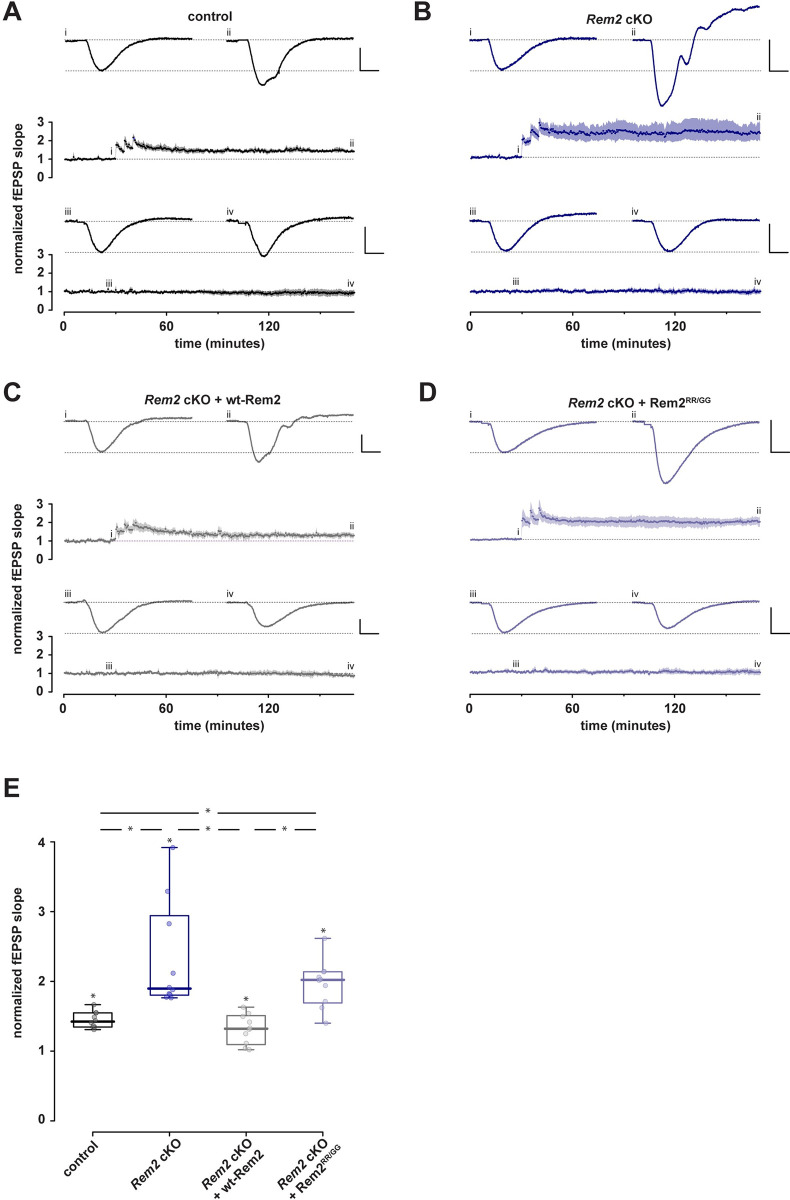
Fig 3. Conditional Rem2 deletion in the CA1 region of hippocampus enhances LTP at the SC-CA1 synapse.
Mice from both sexes were bilaterally injected at P27-P29 with virus and acute hippocampal slices were prepared from injected mice for field recordings at P42-P46. Following a stable baseline period of at least 30 minutes, LTP was induced using three high-frequency stimulation bursts at 100 Hz. Comparisons were made at t = 170 min. A-D). Normalized fEPSP slope is plotted as a function of time for each of 4 conditions; both test and control inputs are illustrated: (A) control, (B) Rem2 cKO, (C) Rem2 cKO + Rem2-wt, and (D) and Rem2 cKO + Rem2RR/GG; (each n = 10). Shaded areas are the (bootstrapped) SEM. Single examples illustrate typical fEPSPs taken at the time points indicated (i, ii, iii, and iv). Vertical and horizontal scale lines indicate 0.5 mV and 5 ms, respectively. E) Summary box plots of normalized fEPSP slopes in the 4 conditions. Any significant effect is illustrated by *.

