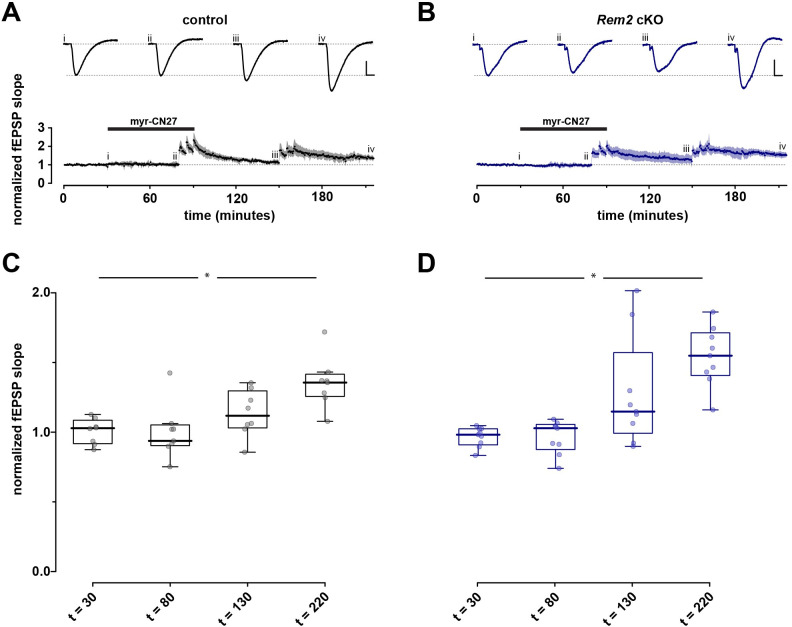
Fig 4. LTP observed in Rem2 cKO is CaMKII dependent.
After a stable baseline (30 min) was obtained myr-CN27 (1 μM) was bath applied for 50 minutes then three 100 Hz tetani were delivered with myr-CN27 still in bath after which myr-CN27 was washed out for 60 minutes. Subsequently three 100Hz tetani were delivered and the recording was continued for 60 minutes. A, B) Normalized fEPSP slope as a function of time for control (A, n = 8) and Rem2 cKO (B, n = 9). Shaded areas are the (bootstrapped) SEM. Traces above the time plots represent the raw data comprising averages of time points within each experiment taken at the time points indicated (i, ii, etc.). As before, vertical and horizontal scale lines indicate 0.5 mV and 5 ms, respectively. C, D) Summary box plot to illustrate normalized fEPSP slope for control (A, n = 8) and Rem2 cKO (B, n = 9). Any significant effect is illustrated by *. There was no difference between control and Rem2 cKO animals for comparable conditions.

