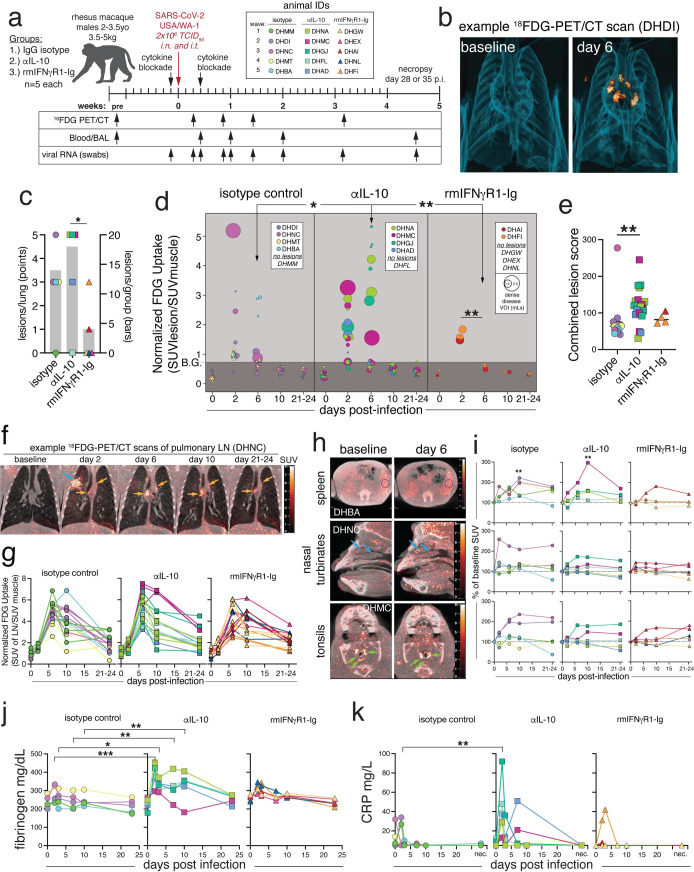
Fig 1. SARS-CoV-2 induced lung inflammation is increased with IL-10 blockade and decreased with IFNγ blockade.
(A) Experimental design: Fifteen male rhesus macaques, with n = 5 per group: IgG isotype control, anti-IL-10, or anti-IFNγ (rmIFNγR1-Ig). Animals were treated with 10mg/kg of monoclonal antibody i.v. one day prior to infection and three days after infections with SARS-CoV-2/USA/WA-1 at a dose of 2x10⁶ TCID50, administered intranasal (i.n.) and intratracheal (i.t.). Sampling was performed at the indicated timepoints. Individual animal IDs are indicated and used throughout. (B) 3D rendering of representative lung 18FDG-PET/CT images from baseline and 6 post infection from isotype control animal (DHDI). (C) Number of lesions per animal (left axis, points) and average number of lesions per group (right axis, grey bars). Significance calculated with individual t-test with Welch’s correction for lesions per animal. (D) Quantification of FDG uptake in standard uptake value (SUV) normalized to muscle, and volume of individual lesions (size of dot), based on volume of interest (VOI) > -550 Hounsfield units (HU) defined at days 2 or 6 post-infection. Significance was calculated with individual t-test with Welch’s correction for FDG uptake at day 6 between groups and Tukey’s multiple comparison test of day 2 vs. day 6 within each group. (E) Lesion score for individual lesions calculated as the sum of normalized max FDG uptake, normalized max Hounsfield’s units, and normalized max volume. Significance calculated with Dunn’s multiple comparison test. (F) Example PET/CT images showing pulmonary lymph node FDG signal from baseline, day 2, 6, 10, and 21–24 post-infection from isotype control animal DHNC. Orange arrows indicate lymph nodes and blue arrow indicates a lung lesion. (G) Quantification of metabolic activity of lymph nodes as measured FDG uptake in SUV, normalized to muscle. All time points post-infection were statistically significant over baseline by 2-way ANOVA and Tukey’s multiple comparison test. (H) Example PET/CT images with evidence of FDG signal from spleen, nasal turbinates, and tonsils from baseline and day 6 post infection. Animal IDs are embedded in image. DHBA and DHNC (isotype). DHMC (anti-IL10). (I) Quantification of change in FDG uptake (SUV) calculated as change from baseline for each animal with detectable signal from spleen, nasal turbinates, and tonsils. Significance calculated by 2-way ANOVA and Tukey’s multiple comparison test. (J) Plasma fibrinogen levels in mg/dL. Significance calculated with 2-way ANOVA and a Dunnett’s multiple comparison test. (K) Plasma C-reactive protein (CRP) in mg/L. Limit of detection >5mg/L. Significance calculated with a 2-way ANOVA and a Dunnett’s multiple comparison test. Panel A generated in part with BioRender.com.

