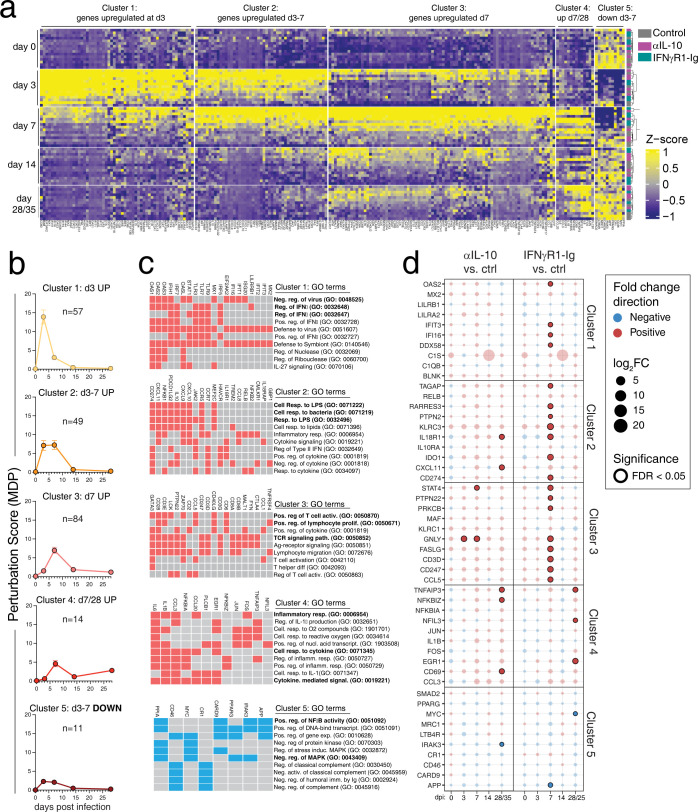
Fig 3. IFNγ blockade prolongs transcriptional signatures of innate and adaptive immune response to SARS-CoV-2 infection.
(A) Heatmap of mRNA expression by z-score of BAL immune cells at day 0, 3, 7, 14, and 28–35 after SARS-CoV-2 infection. Genes were pre-filtered on genes that responded to infection, see methods. K-means clustering was used to group genes in to five clusters. (Right) The sample key is based on treatment, grey = control, pink = anti-IL-10, and teal = rmIFNγR1-Ig. (B) Molecular degree of perturbation (MDP) for each gene was calculated based on change from baseline and summarized for each cluster. The number above each graph indicates the number of genes included in each cluster. (C) Gene ontology (GO) classification was performed, and the top significant pathways are shown with the genes included in the pathways highlight in red for genes that are increased over baseline and shown in blue for genes that are downregulated over baseline, identified with EnrichR. Statistical significance reported in S1 Table. (D) The top 10 genes in each cluster were determined and the fold change in each treatment group were compared to controls. The size of the circle represents the fold change, and the color of the circle indicates if the gene is upregulated or downregulated compared to control, at each timepoint. Significant changes are highlighted with bold outline (false discovery rate (FDR) <0.05).

