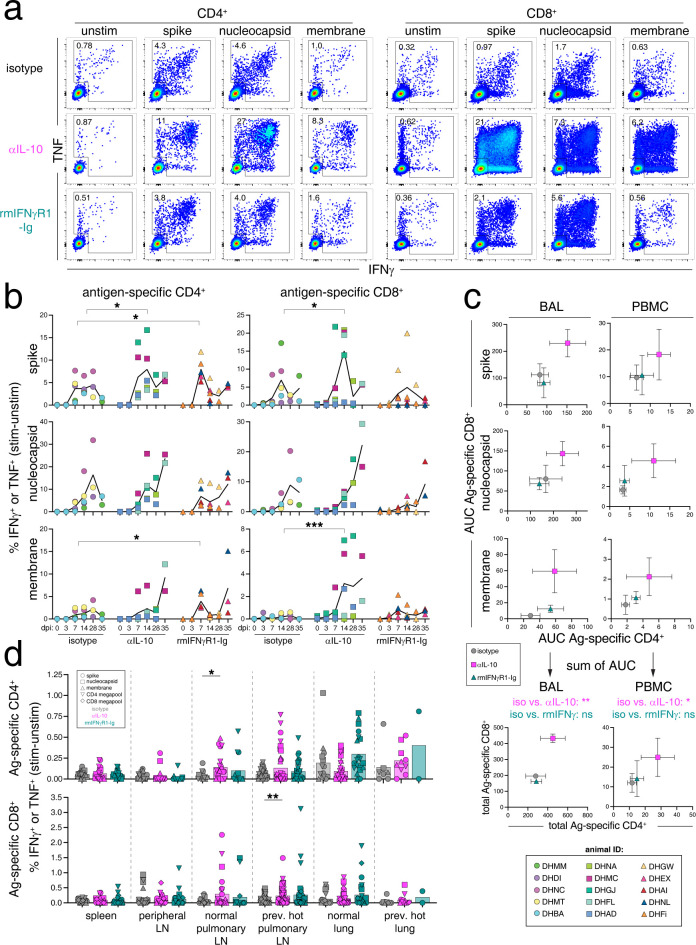
Fig 4. IL-10 blockade increases SARS-CoV-2-specific T cell responses in the blood and BAL fluid.
(A) Representative flow cytometry plots of CD4+95+ and CD8+95+ T cells from the bronchoalveolar lavage (BAL) at day 14 post-infection responding to ex vivo peptide stimulation assay with SARS-CoV-2 15-mer peptide pools for spike (S), nucleocapsid (N), and membrane (M) proteins by production of IFNγ and TNF production. Numbers in plots are the frequency of the gated cytokine+ population. (B) Quantification of frequency of antigen specific CD4+95+ and CD8+95+ responses in BAL at baseline (dpi 0), days 3, 7, 14, and necropsy (dpi 28 or 35), calculated by taking the frequency of IFNγ+ or TNF+ in the stimulated samples and subtracting the frequency in the matched unstimulated samples. Each animal is represented as a point and the mean as a line for each treatment group. Legend is in bottom right corner. Significance calculated by 2-way ANOVA with Dunnett’s multiple comparison test. (C) The mean and SEM of the area under the curve (AUC) for antigen-specific CD4 T cell responses (x-axis) and antigen-specific CD8 T cell responses (y-axis) responses in BAL and PBMC samples calculated from ex vivo peptide stimulation with spike (S), nucleocapsid (N), and membrane (M), as represented in B. The AUC was determined for dpi 0–28 and interpolated by linear regression for animals necropsied at day 35. The bottom graphs represent the sum of the AUC for the S-, N-, and M-specific CD4 and CD8 T cell responses, and statistics represent a Dunnett’s multiple comparison test for total AUC responses from treatment groups compared to isotype control. (D) Quantification of frequency of antigen specific CD4+95+ and CD8+95+ responses in spleen, peripheral lymph nodes (axillary, cervical, and/or inguinal lymph nodes), normal pulmonary lymph nodes (norm. pulm. LN), previously PET/CT hot pulmonary lymph nodes (prev. hot pulm. LN), normal lung sections (norm. lung), and previously PET/CT hot lung sections (prev. hot lung) at necropsy (dpi 28 or 35), calculated as in B. Each animal is represented as a point and the antigen as a shape. Significance calculated by 2-way ANOVA with Dunnett’s multiple comparison test.

