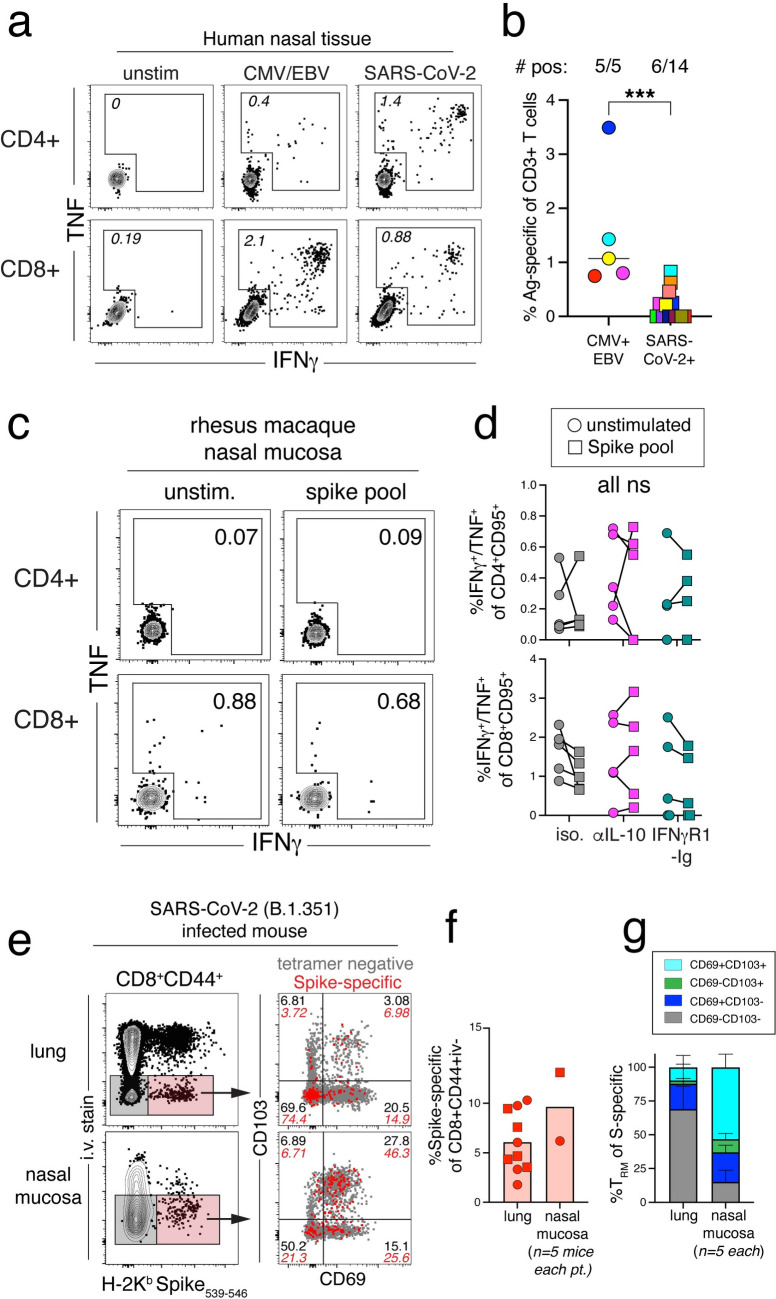
Fig 5. IL-10 blockade does not rescue the lack of SARS-CoV-2-specific T cell responses in the nasal mucosa of rhesus macaques.
(A) Representative flow cytometry plots of cytokine producing CD4+95+ or CD8+95+ T cells after ex vivo peptide stimulation with CMV and EBV peptide pools, SARS-CoV-2 peptide pools, or unstimulated samples from human nasal mucosa. Numbers in plots are the frequency of gated cytokine+ of activated CD4 or CD8 T cells. (B) Quantification of total antigen-specific T cells by cytokine+ (IFNγ+/TNF+) of total CD3+ T cells after stimulation with the indicated peptide pools. Number of samples with positive signal above background were calculated by subtracting the total cytokine+ T cells response in the unstimulated samples from the total cytokine+ response in the stimulated samples. Significance calculated with unpaired t-test. (C) Representative flow cytometry plots of CD4+95+ or CD8+95+ T cells responding to spike peptide pool from the nasal mucosa of isotype control rhesus macaque, DHDI, at necropsy (dpi 28). Numbers in plots are the frequency of the gated cytokine+ in stimulated or unstimulated samples. (D) Quantification of frequency of cytokine+ (IFNγ+ and/or TNF+) CD4+95+ or CD8+95+ T cells responding to spike peptide stimulation at necropsy (dpi 28 or 35) from stimulated and unstimulated samples from the nasal mucosa. Significance calculated with a 2-way ANOVA and Sidak’s multiple comparison test between stimulated and unstimulated samples. (E) (Left) Representative flow cytometry plots of i.v. stain and Spike tetramer (H-2Kb Spike539-546) CD8+CD44+ T cells from the lung and nasal mucosa of mice infected with SARS-CoV-2 (B.1.351) at necropsy (dpi 30). Red shaded gate shows parenchymal (i.v. negative) Spike-specific CD8 T cells and grey shaded gate represents parenchymal (i.v. negative) non-antigen-specific CD8 T cells. (Right) Representative flow cytometry plots of CD69 and CD103 expression by parenchymal (i.v. negative) spike-specific (red dots) and non-specific (grey dots) CD8 T cells from the lung and nasal mucosa. Numbers in plots indicate the frequency within the quadrants. (F) Quantification of the frequency of parenchymal (i.v. negative) spike-specific CD8 T cells from the lung and nasal mucosa from mice infected with SARS-CoV-2 (B.1.351) at necropsy (dpi 30). Data shown from two separate experiments, squares represent one experiment and circles represent a second experiment. Nasal mucosa samples were pooled (n = 5) prior to staining and each experiment represented as one data point. (G) Quantification of the frequency of CD69-CD103- (grey bars), CD69+CD103- (dark blue bars), CD69-CD103+ (green bars), or CD69+CD103+ (turquoise bars), of parenchymal spike-specific CD8 T cells from the lungs and nasal mucosa of mice infected with SARS-CoV-2 (B.1.351) at necropsy (dpi 30).

