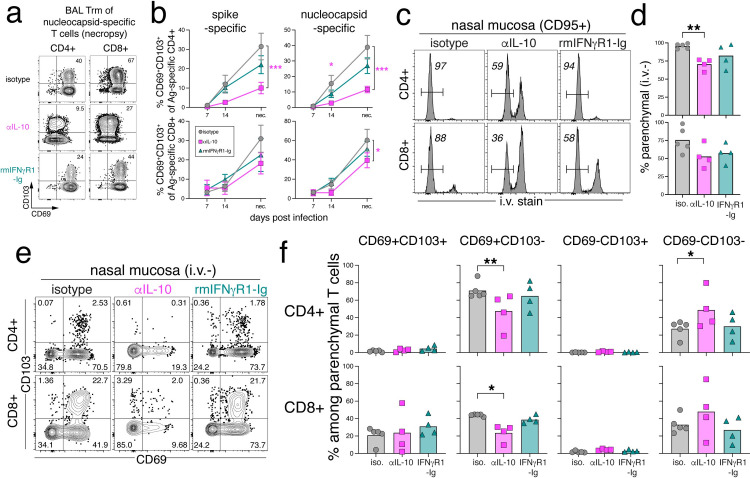
Fig 6. IL-10 blockade impairs the differentiation and maintenance of SARS-CoV-2-specific Trm cells in the respiratory tract.
(A) Representative flow cytometry plots of CD69 and CD103 expression among nucleocapsid-specific CD4+ and CD8+ T cells at necropsy. Numbers in upper right represent the frequency of CD69+CD103+ gate. (B) Quantification of the frequency of CD69+CD103+ among spike-specific and nucleocapsid-specific CD4+ T cells and CD8+ T cells from BAL from day 7, 14, and necropsy (day 28 or 35) post-infection. Graph shows mean and SEM. (C) Representative flow cytometry plots of bulk CD4+95+ or CD8+95+ T cells with intravenous stain (i.v. stain) from the nasal mucosa of rhesus macaques infected with SARS-CoV-2 at necropsy. Numbers in plots indicate the frequency of i.v. stain negative. (D) The frequency of parenchymal (i.v.-) CD4+ or CD8+ T cells from the nasal mucosa of rhesus macaques infected with SARS-CoV-2 at necropsy. Significance calculated with 2-way ANOVA and Dunnett’s multiple comparison test. No i.v. stain data is available for animal ID: DHNA (αIL-10) and DHGW (rmIFNγR1-Ig). (E) Representative flow cytometry plots of parenchymal (i.v.-) CD4+ or CD8+ T cells expressing CD69 and CD103 from the nasal mucosa of rhesus macaques infected with SARS-CoV-2 at necropsy. Numbers in plots indicate the frequency within the quadrants. (F) Quantification of the frequency of CD69-CD103-, CD69+CD103-, CD69-CD103+, or CD69+CD103+ of parenchymal CD4+ or CD8+ T cells from the nasal mucosa of rhesus macaques infected with SARS-CoV-2 at necropsy (dpi 28 or 35). DHNA and DHGW not included, as above. Significance calculated with 2-way ANOVA and Dunnett’s multiple comparison test with isotype control.

