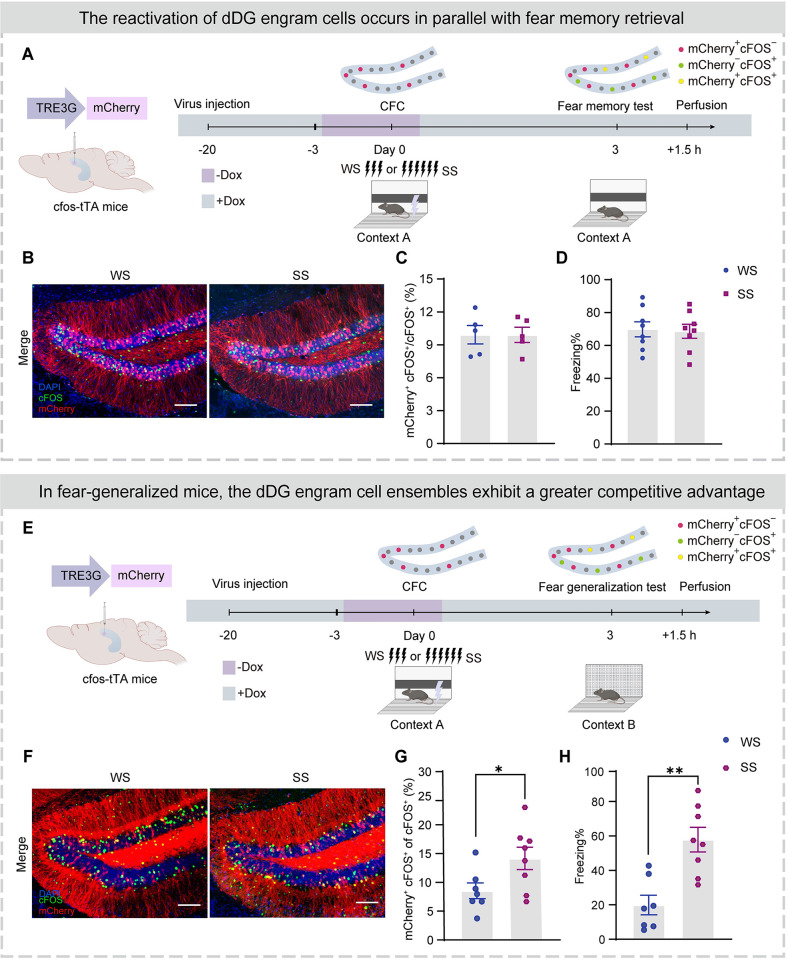
Fig 1. Higher reactivation of fear engram cells in dDG parallels fear generalization in a similar context.
(A) Experimental design. After virus expression, mice were taken off Dox for 2.5 days and subjected to CFC training in context A. Three days later, mice were tested in context B and perfused after testing 1.5 h for immunostaining. Top: Schematic to visualize cells active during CFC and fear memory test. The mCherry+ cells were labeled cells that were activated during CFC. dDG cells activated during the fear generalization test were visualized with immunostaining for endogenous cFOS 90 min after the test. (B) Representative merged images of mCherry+ expressing (red) and cFOS+ immunostaining (green) in the dDG. Nuclei in blue (DAPI). Scale bar, 100 μm. (C) Similar proportions of activated engram cells (mCherry+ cFOS+)/activated cells (cFOS+) between SS and WS groups. (D) WS and SS groups exhibited similar levels of freezing during fear memory test. (E) Experimental design. After virus expression, mice were taken off Dox for 2.5 days and subjected to CFC training in context A. Three days later, mice were tested in context B and perfused after testing 1.5 h for immunostaining. Top: Schematic to visualize cells active during CFC and fear generalization test. The mCherry+ cells were labeled cells that were activated during CFC. dDG cells activated during the fear generalization test were visualized with immunostaining for endogenous cFOS 90 min after the test. (F) Representative merged images of mCherry+ expressing (red) and cFOS+ immunostaining (green) in the dDG. Nuclei in blue (DAPI). Scale bar, 100 μm. (G) Higher proportion of activated engram cells (mCherry+ cFOS+)/activated cells (cFOS+) in the SS group than the WS group. (H) The SS group displayed a higher percentage of freezing levels during the fear generalization test. In Fig 1, statistical comparisons were performed using unpaired Student’s t test. Data were presented as mean ± SEM. *p < 0.05, **p < 0.01. The underlying data and statistical information in Fig 1 can be found in S1 Data. The mice depicted were created with BioRender.com. CFC, contextual fear conditioning; dDG, dorsal dentate gyrus; SS, strong shock; WS, weak shock.

