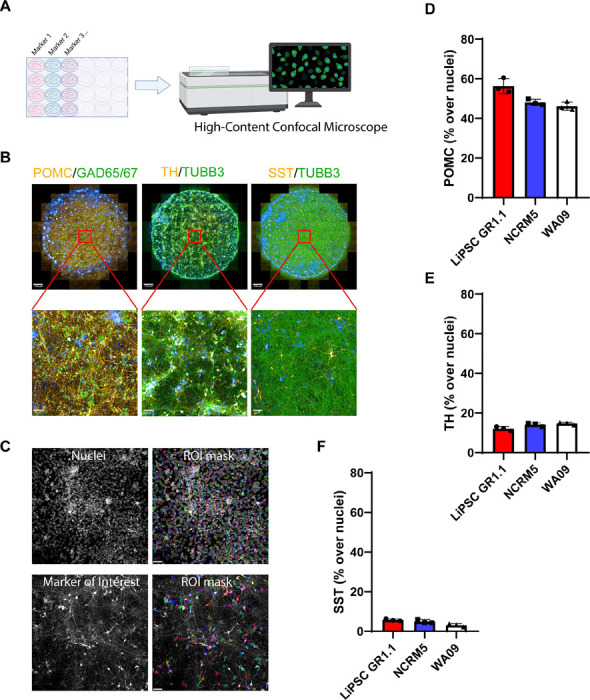
Figure 2. High-content Imaging Analysis of Hypothalamic Neuron Cultures.

(A) Schematic overview of the high-content imaging design and the OperaPhenix imager.
(B) Whole-well images (24-well plate/0.5cm2 area per well/89 images) of DIV 28 neurons capturing the consistent expression of POMC, GAD65/67, TH, TUBB3, and SST across the cultures.
(C) Region of interest (ROI) masks capturing nuclei and the neuronal marker of interest (TH marker segregation represented as an example). Unbiased batch image analysis was performed in Columbus software (Revvity), using a set of predefined parameters.
(D–F) Quantification of POMC, TH, and SST percentage per well. For each marker, three replicate wells were quantified, and each data point represents one well.
Scale bars 500 μm (B – upper row), 50 μm (B -bottom row and C). Hypothalamic neurons derived from LiPSC-GR1.1 were used for high-content imaging experiments.
