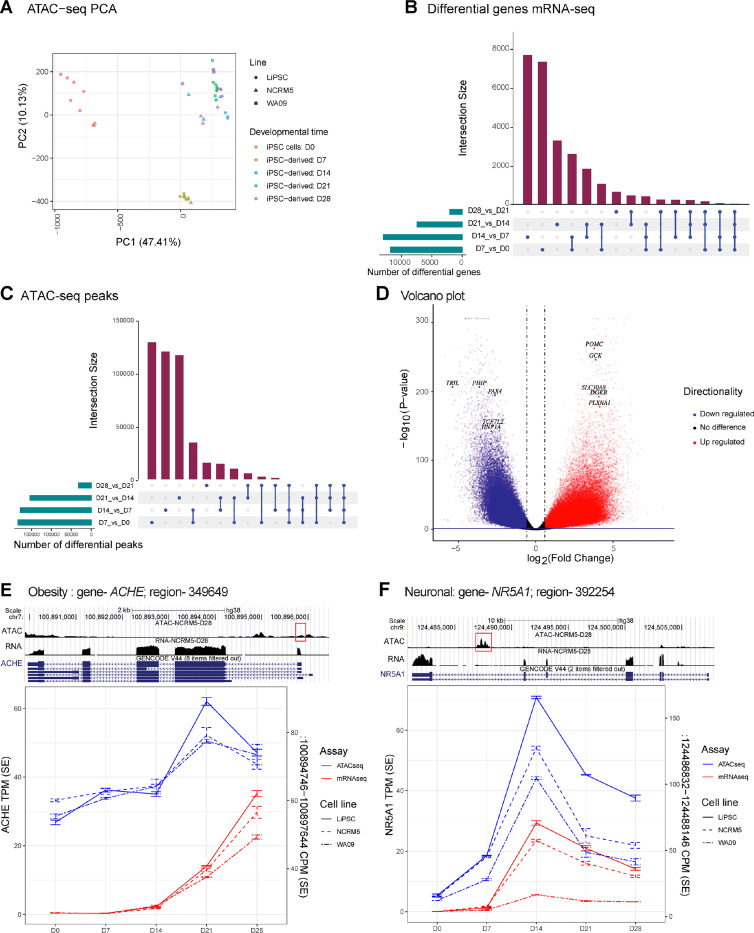
Figure 5. Epigenetic Dynamics of Human Hypothalamus Development Revealed Through ATAC-seq Profiling.
(A) PC 1 and 2 of hPSC derived samples from different timepoints of differentiation based on ATAC-seq data.
(B) Differential genes shared across comparisons of adjacent time points taking into account directionality of expression changes. Note, by D7 and D14, the largest number of genes are up/down regulated.
(C) Similar to Figure 5B, differential peaks shared across comparisons of adjacent developmental time points. Very similar pattern as we observe in the gene expression data.
(D) Volcano plot of differential ATAC-seq peaks between D0 and D28. Highlighted are T2D and obesity related genes.
(E) ACHE association with a potential regulator element in a likely promoter.
(F) NR5A1 association with an intronic ATAC-peak, likely an enhancer. NR5A is an important transcription factor in hypothalamus development.

