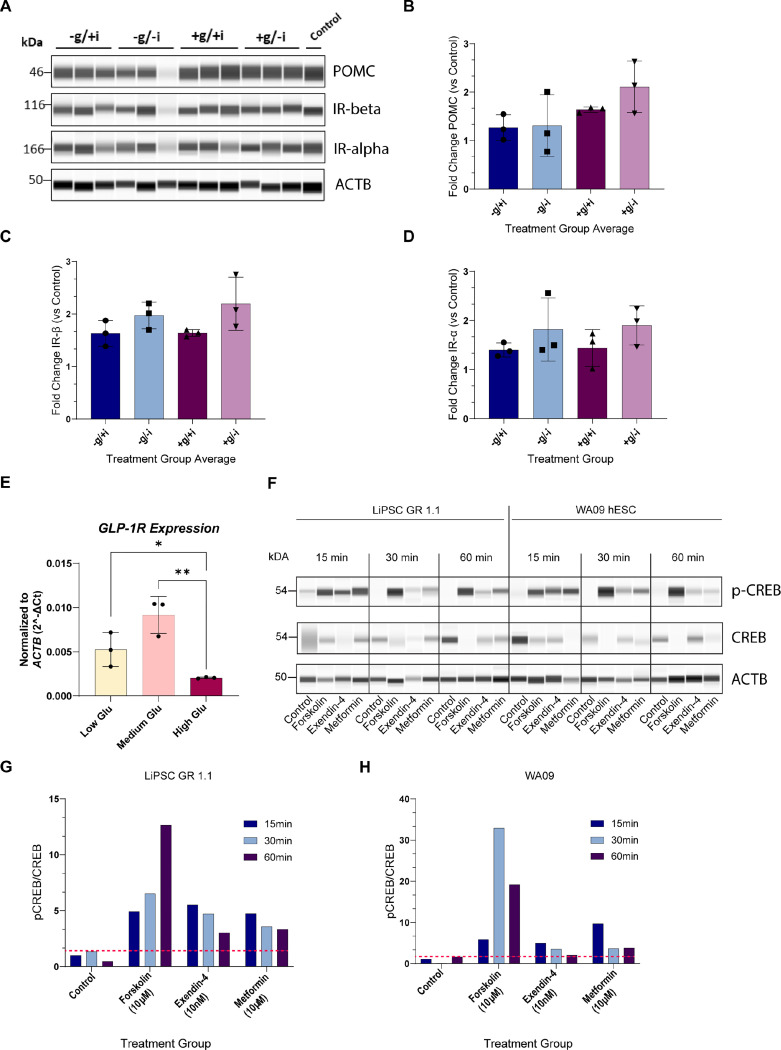
Figure 7. Pulse Assay Experiments to Measure Glucose, Insulin, and Incretin Mimetic Drug Responses.
(A) Western blot analysis of triplicate samples of hypothalamic neurons at DIV 28 (LiPSC-GR 1.1) treated with a combination of low (−) or high (+) glucose, with B27 with insulin (+) or with B27 without insulin (−) over a 96 h period. POMC upregulation is observed in high glucose samples.
(B-D) Bar graph representations of peak area normalized to Beta Actin (ACTB) and no-treatment control show the strongest expression of POMC in high glucose treated neurons (B), while IR alpha and beta show differential upregulation in samples with reduced insulin compared to those with insulin (C, D). One-way ANOVA F(3, 8) = 2.401; P=0.1432 (B), F(3, 8) = 2.363; P=0.1472 (C), F(3, 8) = 1.066; P=0.4161 (D).
(E) RT-qPCR analysis of GLP1R transcript expression in iPSC-derived hypothalamic neurons (LiPSC-GR 1.1) treated with Arc-3 medium with low (1 g/L), medium (4 g/L) and high glucose (9 g/L). Unpaired two-tailed Student’s t-test high vs medium glucose **p=0.0042, medium vs low glucose p =0.0753, low vs high glucose *p=0.045
(F) Western blot analysis of CREB phosphorylation in response to GLP1R/GPCR pharmacological activation. Hypothalamic neurons at DIV 28 (LiPSC-GR 1.1 and WA09) were treated for 15, 30, or 60 min with FDA-approved incretin mimetics (Metformin Hydrochloride and Exendin-4), an adenylyl cyclase activator (Forskolin, positive control), and normalized to Beta Actin and no treatment control.

