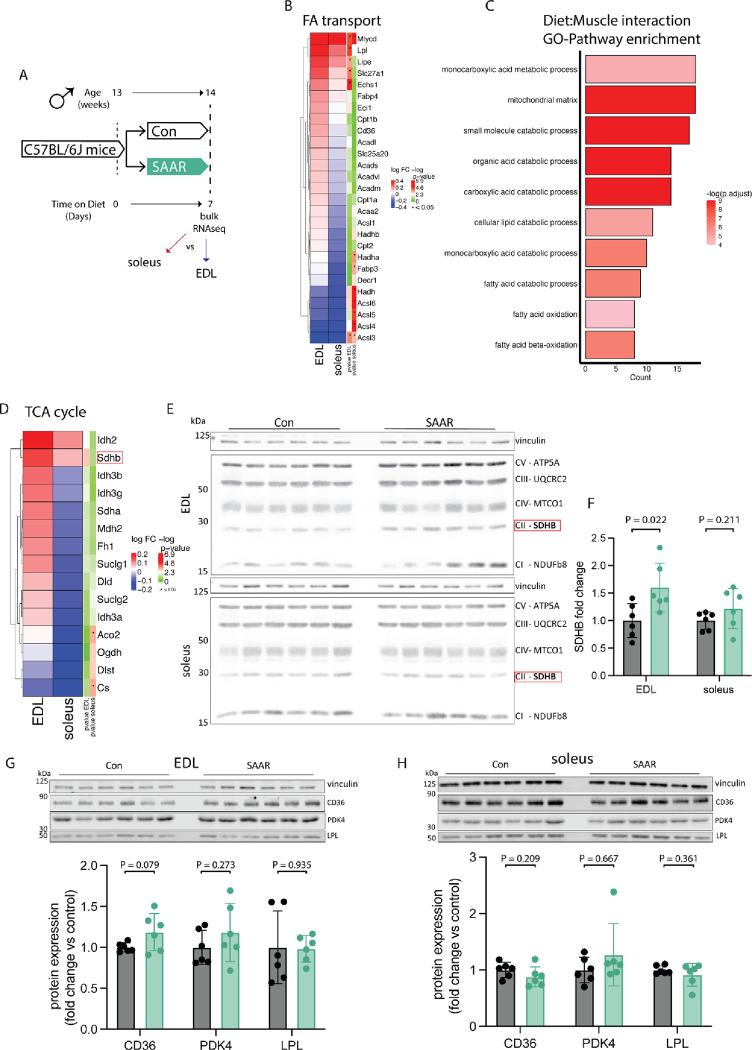
Figure 2. Transcriptomics across muscle depots reveal metabolic shift from glycolytic toward oxidative.
A. Experimental set up and color scheme used throughout figure 2 and figure S2.
B. Fold changes of transcripts associated with fatty acid (FA) catabolism and transport as identified in supplementary figure 2A in muscle of male mice (n = 6) given ad libitum access to sulfur amino acid restricted (SAAR) versus control (Con) diet for seven days.
C. Pathway enrichment analysis of genes showing significant diet by muscle interaction effects.
D. Fold changes (SAAR vs Con) of TCA cycle genes in EDL and soleus.
E. Representative blots of electron transport chain complexes and
F. quantification of relative protein abundance normalized to vinculin of SDHB for EDL and soleus (n = 6) of male mice given ad libitum access to SAAR versus Con diet on day seven.
G. Representative blots of CD36, LPL and PDK4 and vinculin (top) and quantification of relative protein abundance normalized to vinculin of CD36, PDK4, and LPL (bottom) in EDL (n = 6) of male mice given ad libitum access to SAAR versus Con diet on day seven.
H. Representative blots of CD36, LPL and PDK4 and vinculin (top) and quantification of relative protein abundance normalized to vinculin of CD36, PDK4, and LPL from blots (bottom) in soleus (n = 6) of male mice given ad libitum access to SAAR versus Con diet on day seven.
All data is shown as mean and error bars indicate SD unless otherwise noted; p values indicate the significance of the difference by Student’s t test between diets; significance is determined by a p value of p < 0.05. See also Figure S2 and Table S2.

