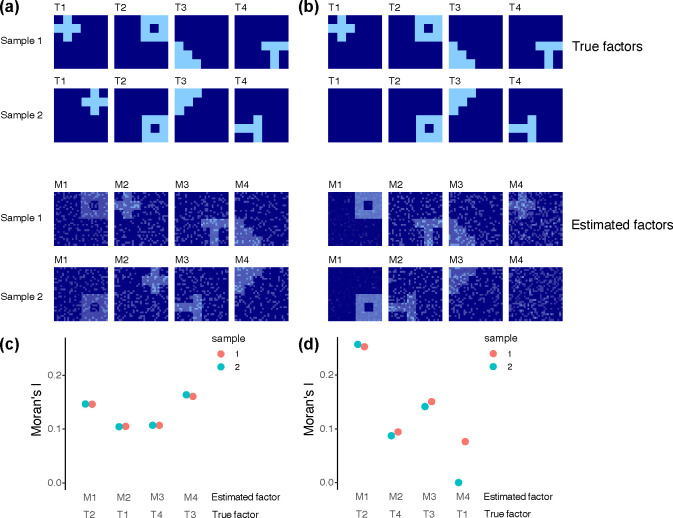
Figure 1. Multi-sample NSF on simulated data |.
(a) We generate 4 true factors for 2 samples, labelled T1-T4. Using these 4 spatial features, we generate noisy expression data for 500 genes following the approach in (Townes, Engelhardt, 2023). Simulated true factors are shown in the top two rows. Factors in sample 2 are the same as sample 1 except they are each rotated 90 degrees anticlockwise. mNSF factors are shown in the bottom two rows. The order of the factors estimated by mNSF is arbitrary and we manually pair each true factor with the estimated factor which best represent it. (b) As (a) but factor T1 for sample 2 is set to 0. (c,d) Moran’s I for each of the 4 estimated factors across the 2 samples in the (c) first and (d) second simulation.

