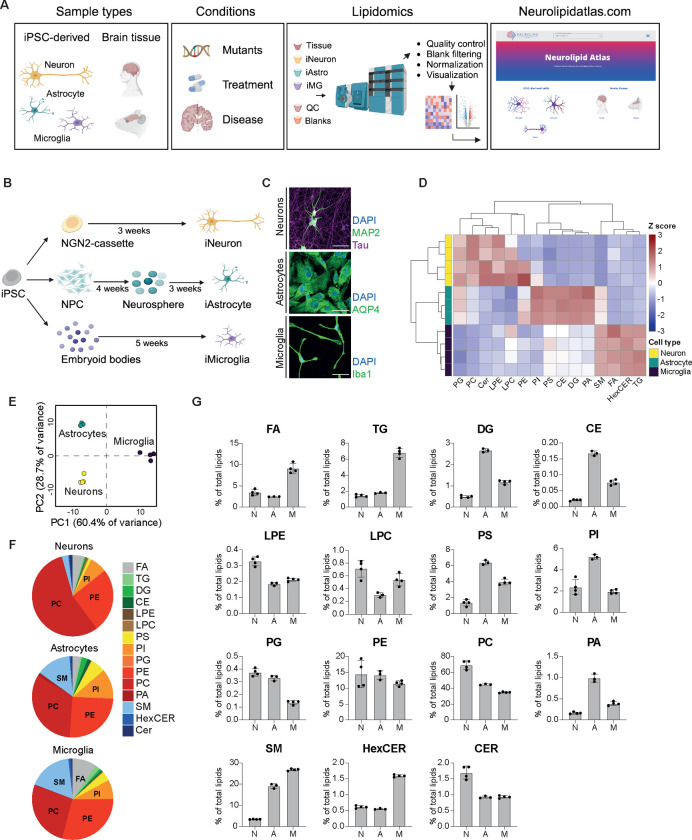
Figure 1. Lipotypes of human iPSC-derived neurons, astrocytes and microglia.
A) Schematic overview of the Neurolipid Atlas work-flow and resource. B) Schematic overview of iPSC differentiation protocols. C) Representative confocal microscopy image of iPSC-derived neurons, astrocytes and microglia in monoculture. Scale bar = 50mm. D) Heatmap of Z scored lipid class abundance in iPSC-derived neurons, astrocytes and microglia (BIONi037-A parental line). E) PCA analysis of iPSC-derived brain cell lipotypes. F) Pie charts showing relative abundance of all detected lipid classes in the iPSC-derived brain cell types. G) Bar graphs present individual lipid class levels in each cell type, normalized to total lipid level. N (Neurons) n=4 wells, A (Astrocytes) n=3 wells, M (Microglia) n=4 wells. Mean + SD.

