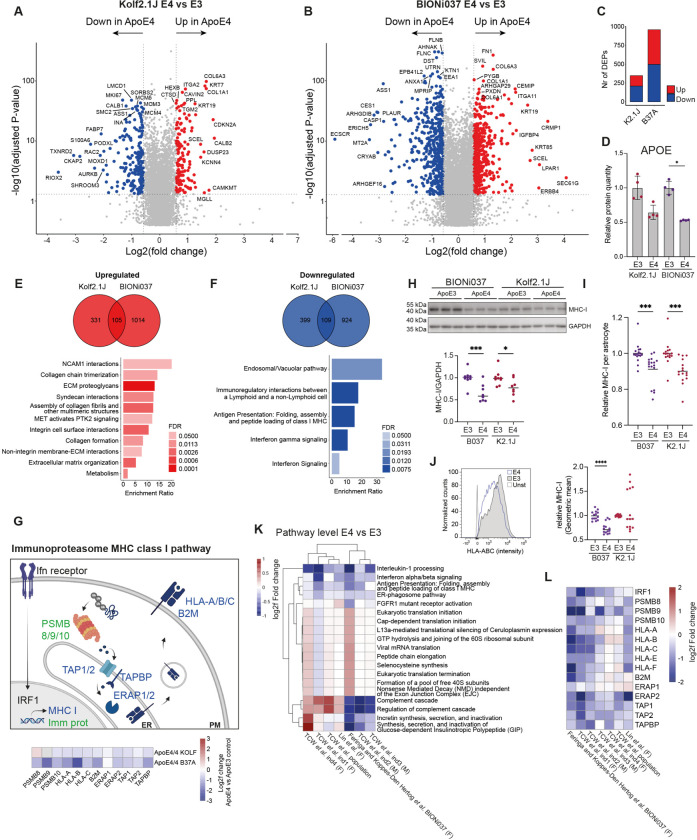
Figure 4. Proteomic and transcriptomic analysis of human isogenic APOE3/3 and APOE4/4 iPSC-derived astrocytes.
A-B) Log2fold changes in protein levels in ApoE4 vs ApoE3 iAstrocytes from Kolf2.1J (A) and BIONI037 (B). Top ten proteins with highest log2fold change and top ten proteins with most significant P-value are labeled. n=4 wells per genotype. C) Number of DEPs (fold change > 1.5 & FDR <0.05) detected in ApoE4 vs ApoE3 iAstrocytes of Kolf2.1J or BIONi037 isogenic sets. D) Relative ApoE protein levels in ApoE3 and ApoE4 iAstrocytes (from proteomic analysis) from BIONi037 and Kolf2.1J background. Mean + SD *P<0.05 Mann-Whitney U test. E-F) Venn diagrams depicting the number of DEPs significantly upregulated (E) or downregulated (F) >1.25 fold times (>0.3 log2fold) in Kolf2.1J, BIONI037 or both ApoE4 iAstrocytes. A reactome overrepresentation analysis was performed on the 105 common upregulated (E) or 109 common downregulated (F) proteins and the enrichment ratio was plotted for all significant pathways (FDR <0.05). G) Schematic overview of interferon-dependent regulation of MHC class I antigen presentation (in blue) and immunoproteasome (in green) pathways. Heatmap indicated log2fold change of indicated proteins in ApoE4 vs ApoE3 iAstrocytes. PM = plasma membrane, ER = endoplasmic reticulum. H) Representative western blot and quantification of MHC-I levels (anti-HLA Class I Heavy Chain) in ApoE4 van ApoE3 iAstrocytes. BIONi037 (B037) and Kolf2.1J (K2.1J). n=8 wells from 3 independent experiments per line. Mean ***P<0.001 Mann-Whitney U test. I) Quantification of intracellular MHC-I levels as measured by immune fluorescence microscopy (stained for HLA-A,B,C). n=17 (B037) n=18 (K2.1J) wells from 6 independent experiments per line. Mean ***P<0.001 Mann-Whitney U test. J) Representative histogram (BIONi037) and quantification of plasma membrane MHC-I levels (stained for anti-HLA Class I Heavy Chain) by flowcytometry. Unst = unstained control. n=14 wells from 6 independent experiments per line. Mean ***P<0.001 Mann-Whitney U test. K) Comparison of significant reactome pathways (by gene-set enrichment analysis) from our transcriptomic analysis of ApoE4 vs ApoE3 (BIONi037) astrocytes with previously published datasets. Shown is the average log2fold change of all genes in the indicated pathway. TCW et al. ind1–4 (four different isogenic sets) and population (ctrl vs ApoE4 subjects) represent iPSC-derived astrocytes from 10, Lin et al. represents one isogenic set of ApoE4 vs ApoE3 iPSC-derived astrocytes from 8. (F)=Female (M)=Male L) Heatmap shows the log2fold change in individual genes in the MHC I and immunoproteasome pathway across indicated studies, including our data here. (F)=Female (M)=Male

