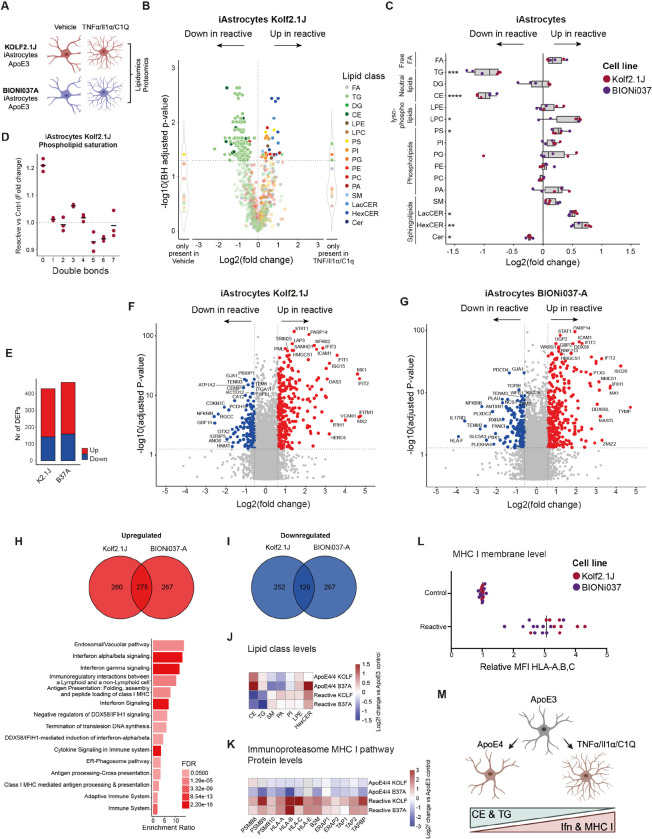
Figure 5. Lipidomics and proteomic analysis of reactive human iPSC-derived astrocytes.
A) Schematic overview of experimental design, a cocktail of TNF/Il-1a/C1q was added for 24h hours to make astrocytes reactive. B) Log2fold change of altered individual lipid species in reactive vs control iAstrocytes (Kolf2.1J ApoE3). n=3 wells per condition. C) Fold change of all phospholipid species with indicated number of double bonds (unsaturation) in reactive vs control iAstrocytes (Kolf2.1J ApoE3). D) Summary data of changes in all detected lipid classes in reactive vs control iAstrocytes. n=3 wells per line. Mann-Whitney U test with Benjamini-Hochberg correction *=P<0.05. E) Number of DEPs (fold change > 1.5 & FDR <0.05) in reactive vs control iAstrocytes for indicated lines F-G) Log2fold changes in protein levels of reactive vs control iAstrocytes for Kolf2.1J (F) and BIONi037 (G). Top ten proteins with highest log2fold change and top ten proteins with highest P-value are labeled. n=4 wells per genotype. H) Venn diagram depicting the number of proteins that were significantly upregulated (H) or downregulated (I) >1.25 fold (>0.3 log2fold) in reactive Kolf2.1J, BIONi037 and both iAstrocytes. A reactome overrepresentation analysis was performed on the 275 common upregulated or 129 common downregulated proteins. No significantly enriched downregulatd pathways were observed, the enrichment ratios for all significantly (FDR<0.05) upregulated pathways are plotted in H. J) Heatmap depicting the log2fold change of indicated lipid classes (changed in ApoE4 iAstrocytes with P<0.1) in ApoE4 or reactive astrocytes vs ApoE3 control iAstrocytes. K) Heatmap depicting the log2fold change of indicated proteins from the MHC class I and immunoproteasome pathway in ApoE4 or reactive astrocytes vs ApoE3 control iAstrocytes. (Based on proteomics data) L) Relative membrane MHC-I levels (stained for anti-HLA Class I Heavy Chain) by flowcytometry in reactive vs control iAstrocytes. n=11 wells BIONi37 from 5 independent experiments and n=9 wells Kolf2.1J from 4 independent experiments. ****p<0.0001 unpaired t-test. M) Schematic representation of opposing lipidomic and proteomic phenotypes in ApoE4 and reactive iAstrocytes.

