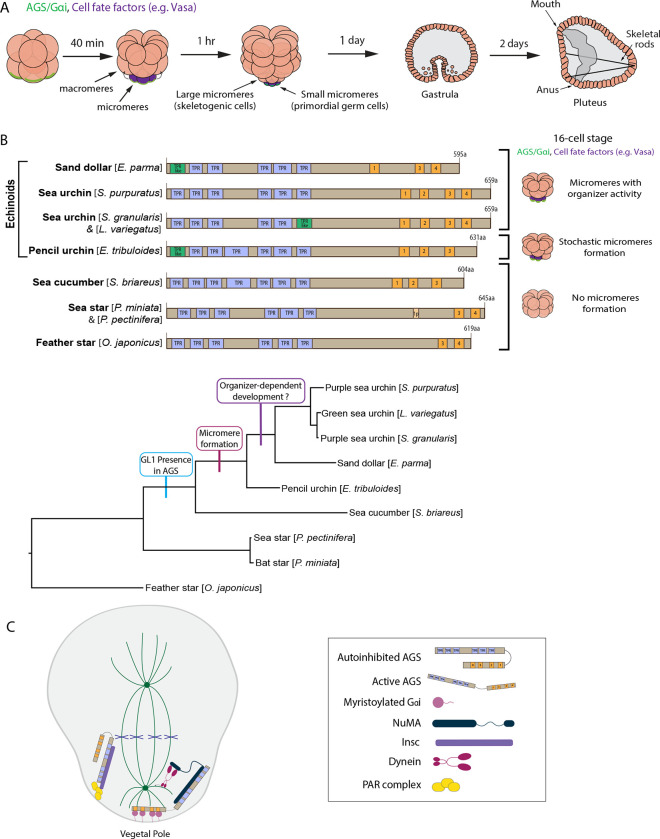
Figure 1. The evolutionary modification of the SpAGS protein corresponds to the introduction of micromeres and inductive signaling during echinoid diversification.
A, Schema depicting sea urchin embryonic development from 8-cell stage to pluteus. Green represents the colocalization of AGS and Gαi at the vegetal cortex, and purple represents the early segregation of fate factors such as Vasa. B, Comparative diagrams of predicted motifs of each echinoderm AGS protein, based on NCBI blast search results for AGS sequences. Conserved TPR motifs are indicated in blue, and GL motifs in orange. Green shows TPR-like motifs, which contain several amino acid changes. Lighter colors represent partial GL motifs. See Fig. S2 for each echinoderm AGS sequence. The tree depicts SpAGS evolution among echinoderms with the introduction of the GL1 motif and micromeres. C, Working model of AGS mechanism in ACD based on fly and mammalian models.

