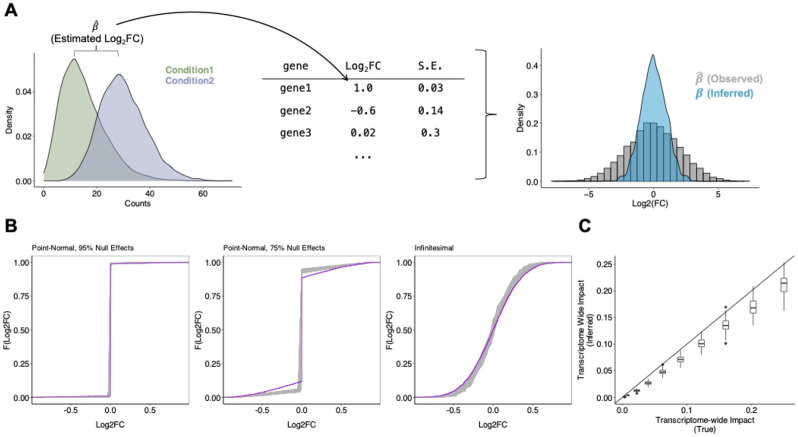
Figure 1: Transcriptome-wide Analysis of Differential Expression.
(A) Schematic for TRADE analysis, starting from condition-wise gene expression counts and ending with estimated distribution of Log2FC. (B) Estimation of various simulated effect size distributions (Point-Normal with 95% Null, Point-Normal with 75% Null, Infinitesimal/normally distributed). Purple trace shows true effect size distribution; gray traces show estimated distributions across 100 replicates. (C) Comparison of estimated and true transcriptome-wide impact in simulations.

