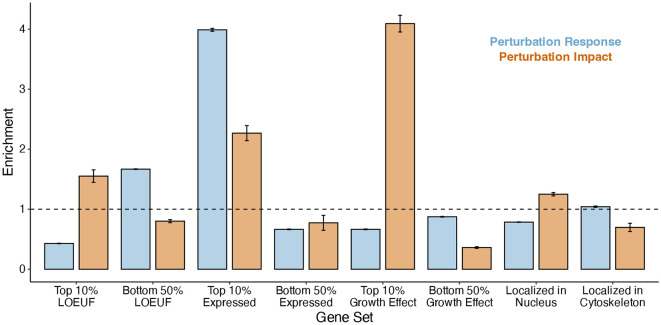
Figure 3: Transcriptome-wide analysis of genome-wide Perturb-Seq.
TRADE-derived enrichment estimates for multiple gene sets. Blue bars represent perturbation response enrichment, the enrichment of differential expression in response to perturbations. Tan bars represent perturbation impact enrichment, the enrichment of effects on other genes when genes in that gene set are perturbed.

