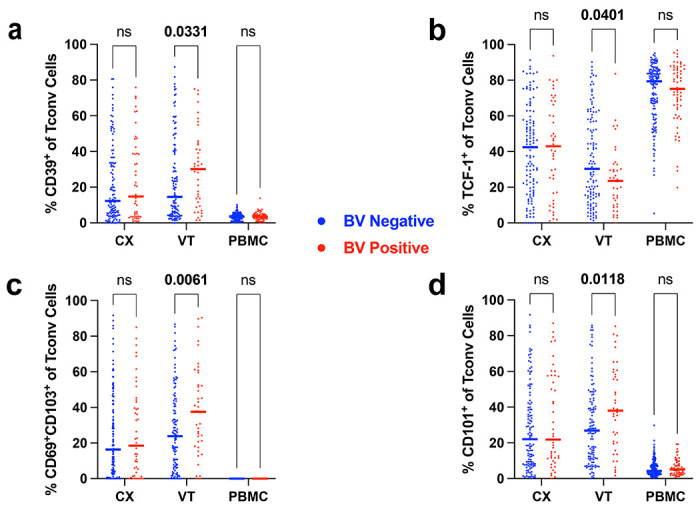
Figure 4. BV is associated with an increase in Tconv with reduced functional potential as well as an increase in the fraction of Tconv with a TRM phenotype in the VT.

Flow cytometry was used to examine Tconv cell phenotypes within different tissue sites as indicated. (a) The frequency of CD39+ (a), T cell factor 1 (TCF-1+) (b), CD69+CD103+ (c), and CD101+ (d) among the total Tconv T cell population in CX, VT, and PBMC samples in BV− and BV+ individuals. Adjusted rank regression T test performed to compare frequencies in each tissue between BV− and BV+ individuals. Adjusted p-value displayed when p ≤ 0.05, and the p-value is labeled “ns” for not significant when adjusted p > 0.05.
