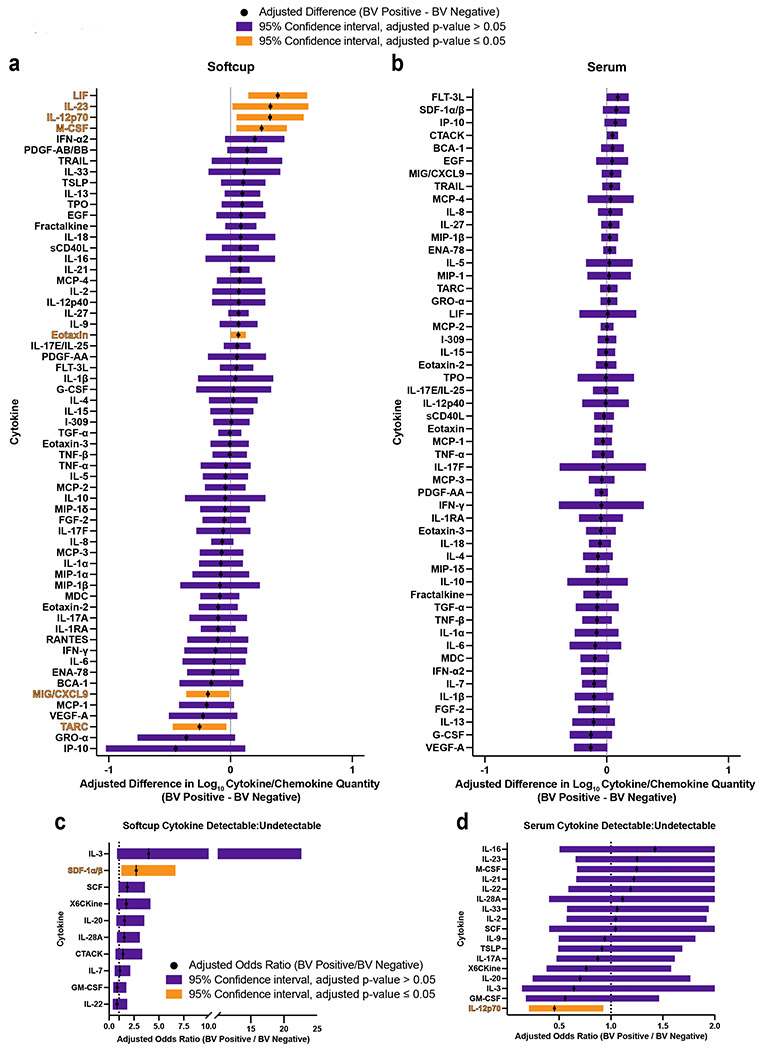
Figure 7. BV drives unique cytokine production in CVT fluid.

Luminex was used to quantify cytokines and chemokines from CVT fluid or serum samples. Adjusted difference (BV positive - BV negative) for CVT fluid cytokines (a) and serum (b) that met the criteria for quantification of cytokine concentrations (greater than or equal to 80% of samples were detectable). Adjusted odds ratio (BV positive/BV negative) for CVT fluid cytokines (c) and serum (d) that did not meet the criteria for quantification of cytokine concentrations (less than 80% of samples were detectable). The 95% confidence interval is shown for all comparisons. Significant results when adjusted p≤0.05 comparing BV− vs BV+ are colored in orange and non-significant differences p>0.05 comparing BV− vs BV+ are purple.
