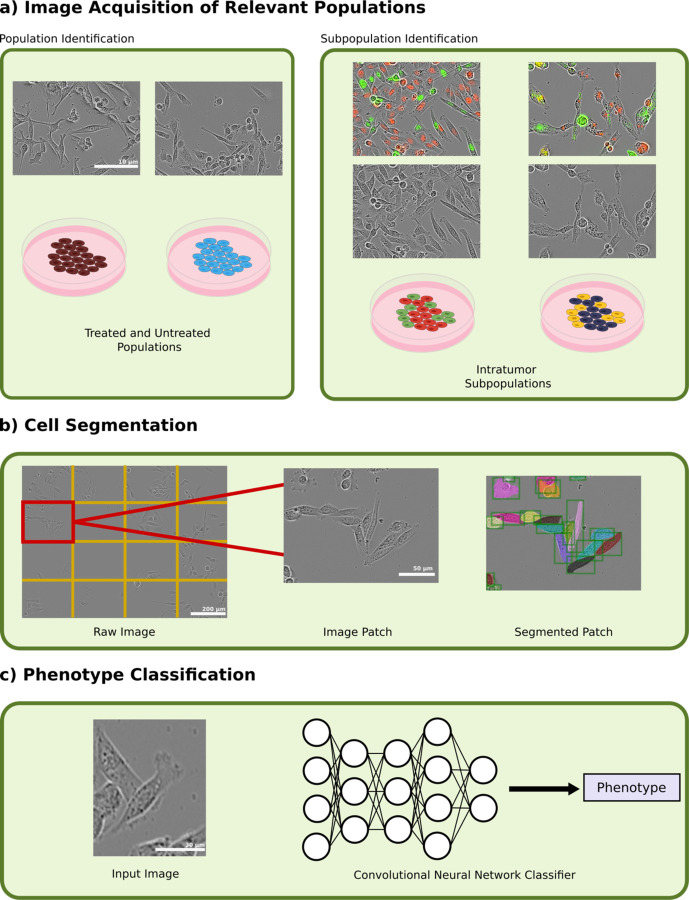
Figure 1.
(a) Phenotype identification was done by first imaging treated and untreated populations of MDA-MB-231 cells and cocultured subpopulations in MDA-MB-231 and MDA-MB-436 cell lines at 20X magnification using phase contrast and fluorescent imaging. Images are contrast-enhanced for visualization purposes only. (b) Cell segmentation was then performed on each image by splitting the image into 16 patches and then segmenting using a Mask R-CNN segmentation network. (c) Input images were fed into a convolutional neural network classifier to that predicted each cell’s phenotype.

