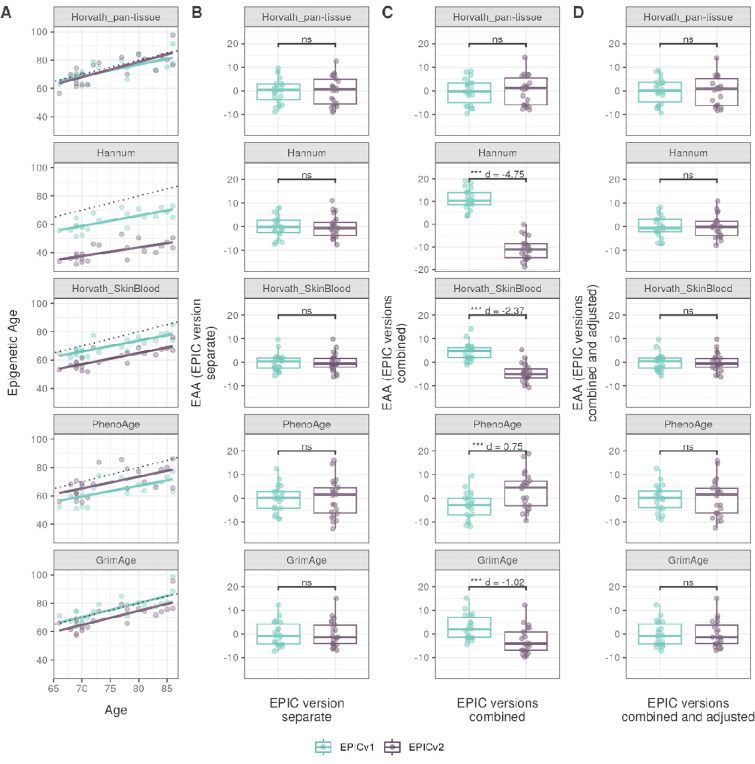
Figure 4.
Epigenetic ages on matched samples assessed on EPICv1 and EPICv2 in VHAS. (A) Scatter plot of Horvath pan-tissue, Hannum, Horvath skin and blood, PhenoAge, and GrimAge clock ages (Y axis) and chronological age (X axis) with dotted line indicating x=y, coloured by EPIC version. (B-D) Boxplots comparing EPICv1 and EPICv2 EAAs calculated by considering (B) EPIC versions separately, (C) combined, and (D) combined and EPIC version adjusted. Statistical significance was defined as Bonferroni adjusted p-value <0.05. ** denotes Bonferroni p <0.05, *** denotes Bonferroni p <0.001, “ns” denotes “not significant”, and “d” denotes effect size measured using Cohen’s d. A positive Cohen’s d indicates higher estimates in EPICv2 compared to EPICv1.

