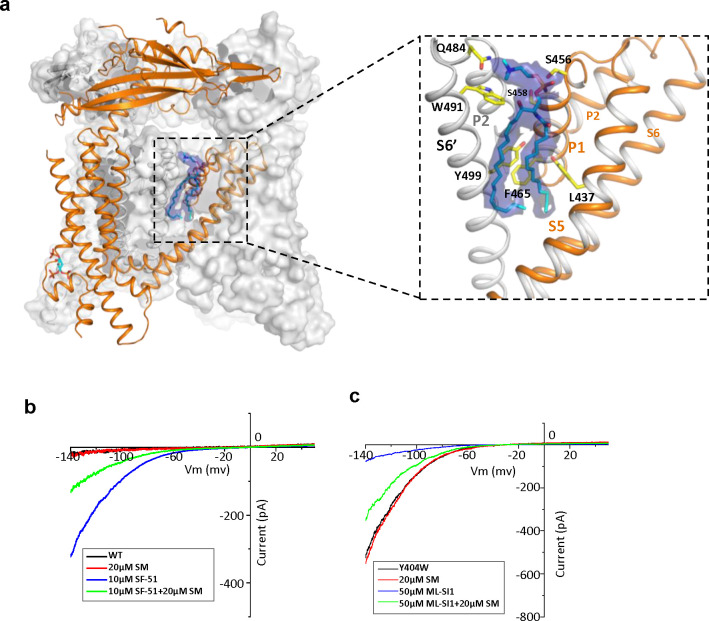
Figure 4. Sphingomyelin binding in TRPML1.
(a) Overall structure of PI(4,5)P2-bound TRPML1 and the zoomed-in view of the lipid-binding site. The lipid density is shown as blue surface and modeled as sphingomyelin (SM). The side chains of lipid-interacting residues are shown as yellow sticks. (b) SM inhibition effect on SF-51-activated wild-type TRPML1. (c) SM activation effect on ML-SI1-inhibited Y404W mutant. Currents shown in (b) and (c) were recorded using patch clamp in whole-cell configuration with pH 4.6 in the bath solution as the adverse effect of SM on agonist or antagonist is subtle and is measurable only at low luminal pH.

