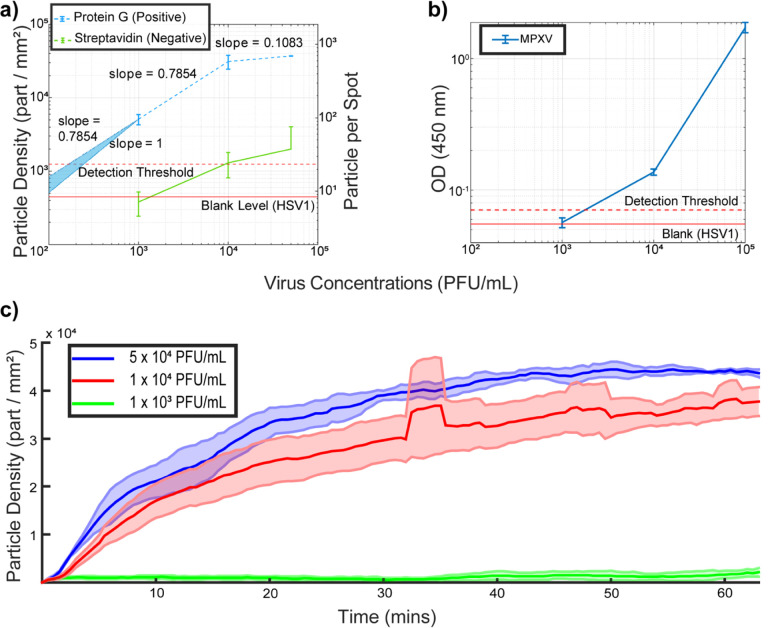
Figure 5:
Estimating the sensitivity of PD-IRIS (a) and ELISA (b) for MPXV detection. The signal obtained from the distractor viruses (HSV-1) was used to determine the limit-of-detection (LOD) level, which is shown as a red dashed line (Mean particle density plus three standard deviations). For PD-IRIS measurements (a), two different FOVs, including three protein G and two streptavidin spots, are analyzed to extract the data points. Once the mean particle density and total detected particles are calculated for each FOV, the error bars are created by calculating the mean and standard deviation of those two FOVs. The error bars for ELISA (c) are calculated from three OD measurements. The LOD curve was extrapolated according to the slope between the least two concentrations of the virus dilutions in PD-IRIS data. The real-time MPXV measurements of PD-IRIS are shown in (c) for three different virus concentrations over the course of the experiment. For each real-time experiment, three different protein G spots are imaged. The solid line represents the mean of those three spots, and the shaded area represents their standard deviations.

