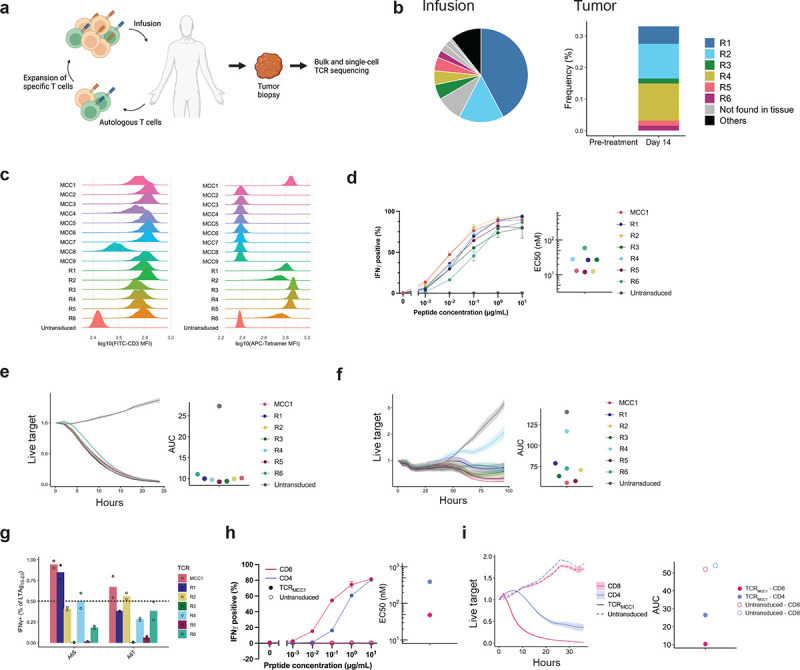
Figure 1. T cells transduced with the anti-MCPyV TCR identified from healthy donor PBMCs showed similar functional avidity but broader recognition of LTAg15–23 variants compared to those identified from responding patient-derived tumor-infiltrating T cells.

a Schema of the expanded autologous T cell therapy with HLA-A*02:01-restricted LTAg15–23-specific CD8+ T cells resulting in MCC regression. b distribution in the infusion product (left) and frequency of the infusion-enriched clonotypes before and after T cell infusion in a regressing tumor biopsy (right). c CD3 expression (left) indicating surface expression of a functional TCR and LTAg15–23 p/HLA binding (right) by endogenous TCR knock-out Jurkat cells. d IFNγ production by CD8 T cells transduced with indicated TCRs exposed to TAP-deficient T2 B lymphoblastoid cell lines (T2-BLCL) exogenously loaded with indicated concentrations of LTAg15–23 (left) and mean half-maximal concentrations (EC50) (right) of three biological replicates for each TCR. 1 ng/mL LTAg15–23 equals 1 nM. e, f Growth kinetics of HLA-A2+ LTAg+ dermal fibroblasts (e) or WaGa cells (f) in the presence of CD8 T cells transduced with indicated TCRs. g IFNγ production by CD8 T cells transduced with indicated TCRs upon coculture with exogenously loaded LTAg15–23 variants (10 μg/mL). Horizontal line indicates 50% threshold below which variant recognition was impaired. Data from two biological replicates are shown. 50% h, i Same as (d, e) comparing CD8 vs. CD4 T cells transduced with TCRMCC1.
