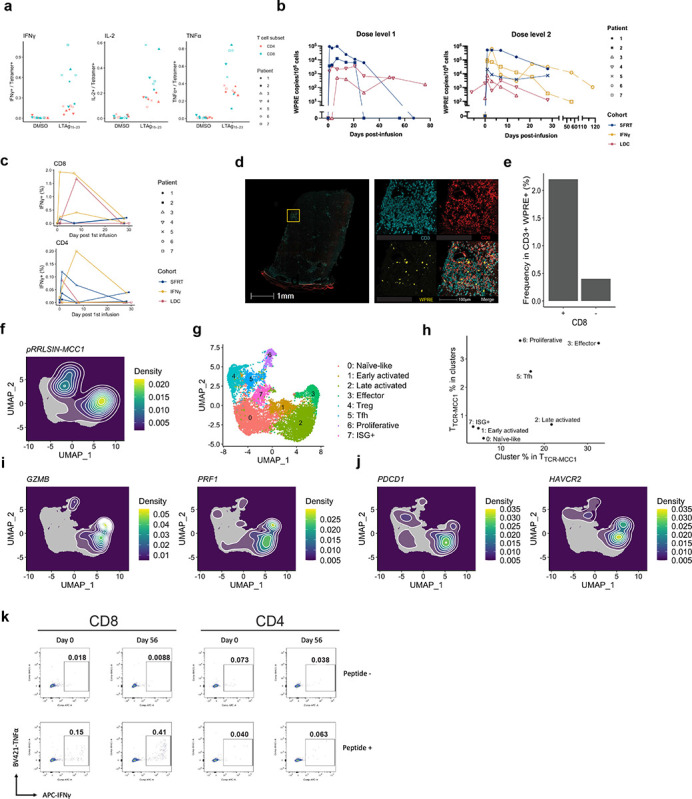
Figure 3. Functional TTCR-MCC1 cells persist in blood and preferentially infiltrate tumors.

a Percent of CD4 and CD8 TTCR-MCC1 within the infusion products that produced IFNg, TNFa or IL-2 in response to LTAg15–23. b Circulating TTCR-MCC1 (WPRE copies/106 cells) (y axis) at indicated timepoints (x axis) for all pts. c Percent of CD4 and CD8 TTCR-MCC1 that produced IFNg in response to 1μM LTAg15–23 at indicated timepoints. d CD3/CD8/WPRE (FISH) staining of Pt 2 ‘escape’ lesion. The right panel shows a zoomed-in image of the selected region in the left panel. e Quantification of CD8+ or CD8- CD3+ WPRE+ cells in (d). f Density of TCRMCC1 cells projected on the UMAP coordinate. g A UMAP plot of T cell populations with cluster annotations. h Frequency of TTCR-MCC1 cells in each cluster (y-axis) and frequency of each cluster in TTCR-MCC1 cells. i, j Density of cells that express indicated genes projected on the UMAP coordinate. k Cytokine production from expanded tumor-infiltrating T cells in Pt 6 biopsies.
