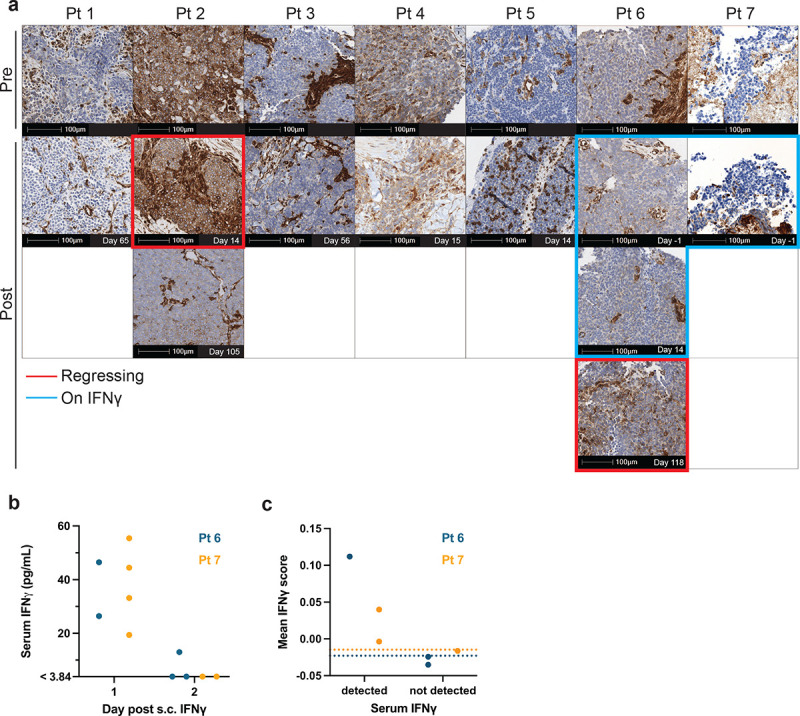
Figure 4. HLA expression/downregulation is associated with tumor regression/progression.

a IHC of class-I HLA in tumor tissues. b Serum IFNγ level detected by Luminex in Pts 6 and 7 during the systemic IFNγ regimen. c IFNγ downstream gene scores calculated in Pts 6 and PBMC scRNA-seq data up to Day 28 post-T cell infusion. Each data point represents a single time point where scores of all cells were averaged. Dotted lines indicate basal levels at pre-IFNγ time points.
