
Figure 5. Activated endogenous T and NK cells expanded in a tumor showing delayed regression.
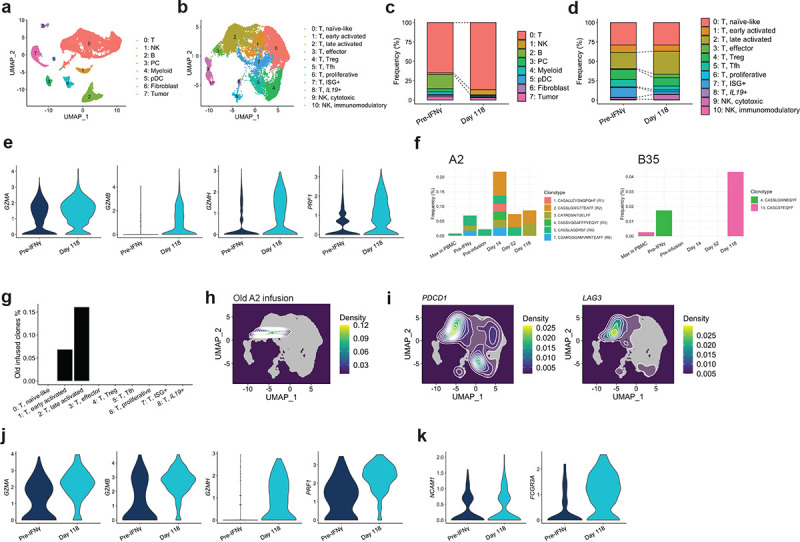
a, b scRNA-seq cluster annotation of major cell types (a) and T/NK cell sub-clusters (b). c, d cluster frequency change from pre-treatment to Day 118, with (c, d) corresponding to (a, b) respectively. e Effector gene expression in T cells of sub-cluster 1–3 combined at the indicated time points. f TCR clonotypes in the infusion products for a previous endogenous T cell trial that were re-discovered in Pt 6 PBMC and tumors. “Max in PBMC” indicates the maximum frequency across tested PBMC time points. g Frequency of old HLA-A2-targeting infusion clones in T cell sub-clusters. h Distribution of the A2-targeting clones on the UMAP plot. i Density of cells that express indicated genes projected on the UMAP coordinate. j, k Effector (j) and phenotypic marker (k) gene expression in NK cells at the indicated time points.