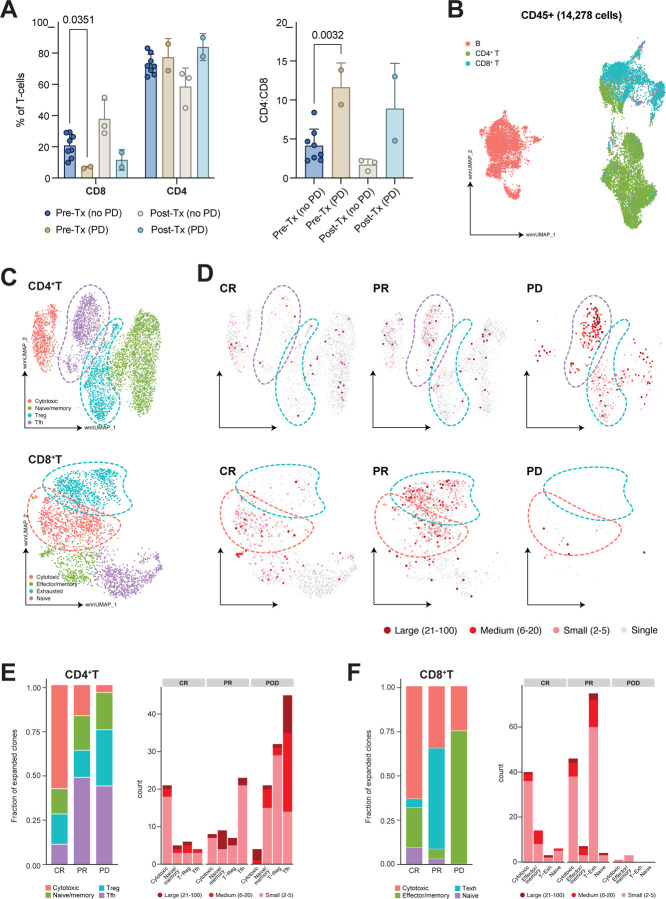
Figure 2. Single-cell immune profiling reveals distinct T-cell states associated with response or resistance to epcoritamab-based therapies.
(a) abundance and proportions of CD4+ and CD8+ T-cells in lymph node biopsies assessed by flow cytometry. (b) UMAP of CD45+ T-cells from on-treatment biopsies, colored by coarse cell type. (c) UMAP of CD4+ (above) and CD8+ (below) T-cells, colored by phenotypic cluster. (d) Clonal abundance of CD4+ (above) and CD8+ (below) T-cells as measured by scTCR-seq, stratified by best response and projected in UMAP space. (e,f) Stacked bar plots showing either fraction of total expanded clones (>1 cell with the same TCR CDR3 sequence) derived from each phenotypic cluster depicted in (c), stratified by best response (left), or clonal abundance, stratified by phenotypic cluster (right), for either CD4+ (e) or CD8+ (f) T-cells. P values calculated using Student’s t-test (a).

