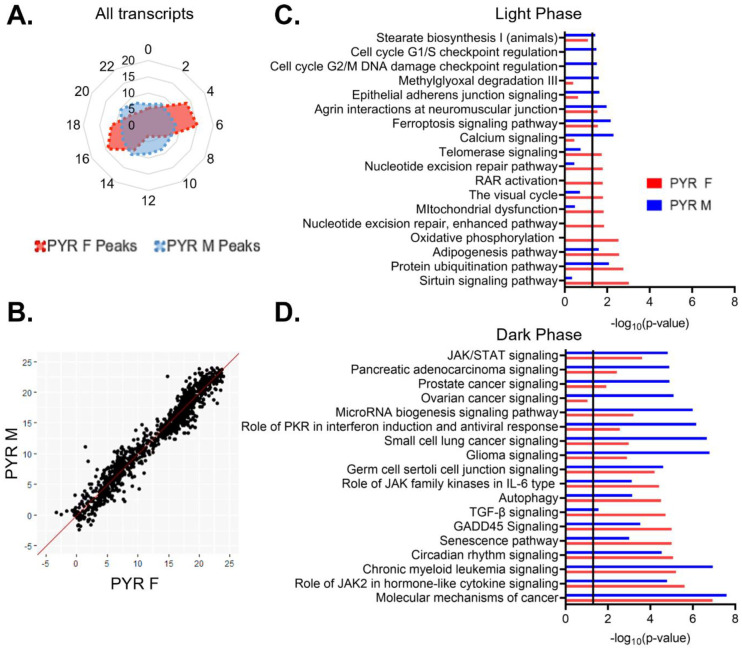
Figure 5. Temporal patterns of rhythmic transcript expression in pyramidal cells differ between sexes.
(A) Radar plot showing the peak time of rhythmic transcripts (p<0.05) across a 24-hour period (ZT). Data is presented as the proportion of total rhythmic transcripts peaking within each 2-hour bin. Females show two distinct groups of rhythmic transcripts, one peaking in the light phase and the other peaking in the dark. Conversely, peak times in males are relatively evenly distributed across 24 hours. (B) Phase concordance plot showing the peak time (ZT) of individual shared rhythmic transcripts in females (X axis) and males (Y axis). Shared rhythmic transcripts peak at similar times in both males and females. (C)&(D) The top 10 pathways (IPA) enriched for rhythmic transcripts in pyramidal cells by the phase in which they peak. Transcripts that peak during the light phase (ZT0–12) are plotted in (C) while transcripts that peak during the dark phase (ZT12–24) are plotted in (D). There is more overlap between sexes, and greater enrichment for rhythmic transcripts, in the dark phase. ZT=Zeitgeber time, PYR=pyramidal cells, IPA=Ingenuity Pathway Analysis

