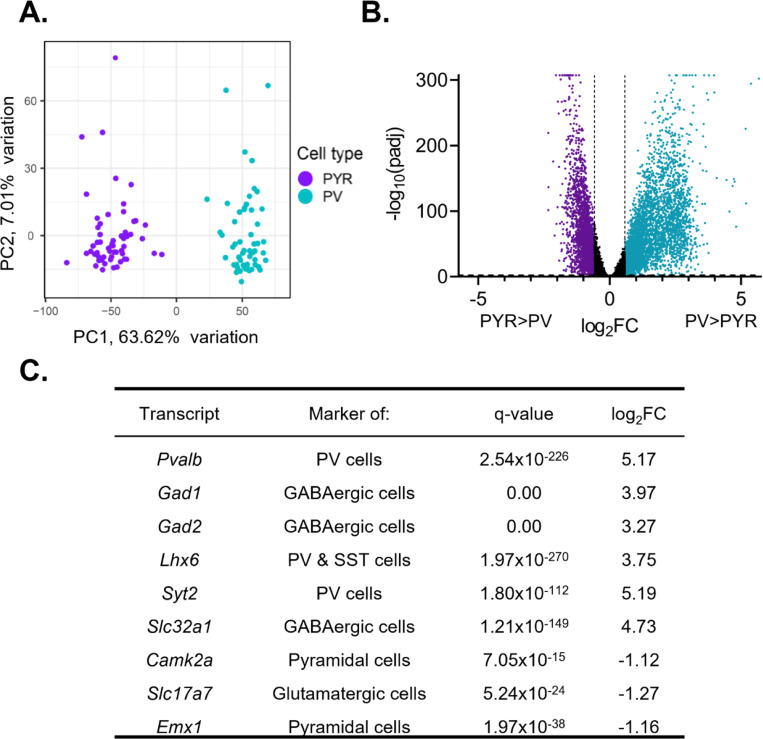
Figure 1. Isolated transcripts differ by cell type.
(A) Principal component analysis was performed using PCAtools on transcripts isolated from presumptive pyramidal cells and PV cells. Samples fall into two separate and distinct groups, segregated by cell type. (B) Differential expression analysis was performed to compare expression between PV and pyramidal cells, with transcripts from both sexes and all time points combined. Transcripts significantly enriched in pyramidal cells are colored purple while transcripts significantly enriched in PV cells are colored blue. Transcripts are considered differentially expressed (enriched) with a log2fold change (log2FC) >0.58 and FDR corrected q-value (padj) <0.01 (-log10(padj)>2). The log2FC and q-value cutoff are displayed as dashed lines. A ceiling effect is present for -log10(padj) in order to accommodate q-values lower than 1.0e-307. (C) The expression of known markers in PV and pyramidal cells. P-values and FDR-corrected q-values are listed. Transcripts enriched in pyramidal cells are indicated by a negative log2FC while transcripts enriched in PV cells are indicated by a positive log2FC. Canonical PV and GABAergic cell markers are enriched in PV cell samples while markers of excitatory and pyramidal cells are enriched in pyramidal cell samples. PYR=pyramidal cells, PV=parvalbumin cells, FC=fold change, padj=FDR-corrected q-value

