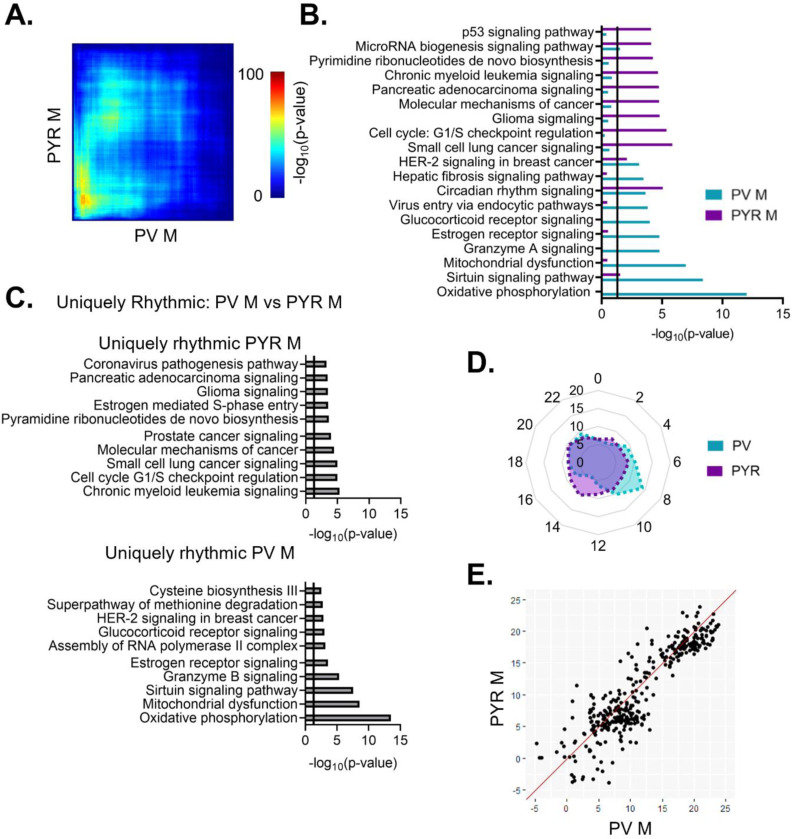
Figure 9. Rhythmic transcripts are largely cell-type specific in males.
(A) Threshold-free approach (rank-rank hypergeometric overlap) assessing the overlap of rhythmic transcripts between PV and pyramidal cells in males. There is limited overlap in rhythmic transcripts between cell types in males. (B) Pathway analysis (IPA) of rhythmic transcripts (p<0.05) across cell types in males. The top 10 pathways and their overlap are plotted. There is very little overlap in pathways enriched for rhythmic transcripts between cell types in males. (C) Top pathways (IPA) enriched for transcripts that are uniquely rhythmic in pyramidal cells (top) or PV cells (bottom). Uniquely rhythmic transcripts are largely associated with the cell cycle in pyramidal cells and oxidative phosphorylation in PV cells. (D) Radar plot showing the peak time (ZT) of rhythmic transcripts across 24 hours, presented as the percentage of total rhythmic transcripts peaking within each 2-hour bin. In males, rhythmic transcripts peak relatively evenly across 24 hours, with a small cluster peaking in the light phase in PV cells. (E) Phase concordance plot showing the peak time (ZT) of individual transcripts in PV cells (X axis) and pyramidal cells (Y axis). Shared rhythmic transcripts largely peak within 3 hours of one another. IPA=Ingenuity Pathway Analysis, PV=parvalbumin cells, PYR=pyramidal cells, ZT=zeitgeber time

