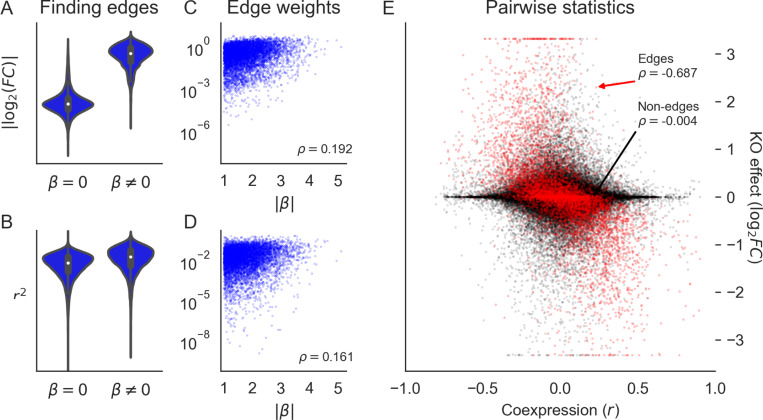
Figure 6: Perturbations more reliably measure fine-scale network structure than coexpression.
(A) Distribution of perturbation effects between pairs of genes in a realistic synthetic GRN that do or do not share an edge. (B) Rank correlation of perturbation effect sizes with edge weights. (C) Distribution of gene coexpression between pairs of genes that do or do not share an edge. (D) Rank correlation of coexpression magnitude with edge weights. (E) Rank correlation between coexpression and perturbation effects (the -axis is clipped at values corresponding to tenfold change).

