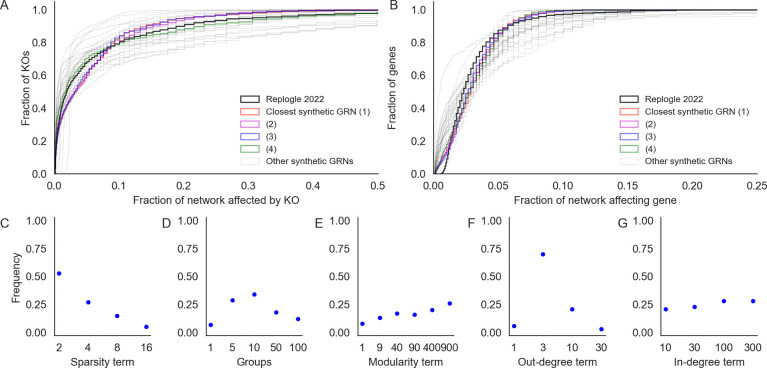
Figure 5: Comparing with genome-wide Perturb-seq.
Fraction of GRN that (A) affects each gene when perturbed (outgoing effects) or (B) is affected by other perturbations (incoming effects). In synthetic data, perturbation effects are thresholded at the top 3% of absolute log-fold change values, matching the proportion of pairwise tests from the Perturb-seq data with FDR-corrected Anderson-Darling p < 0.05. Highlighted in color are the four GRNs that best match the Perturb-seq data. (C-G) Distribution of network generating parameters for the 100 GRNs that are best matched to Perturb-seq data (by Kolmogorov-Smirnov p-value rank for both distributions in A and B).

