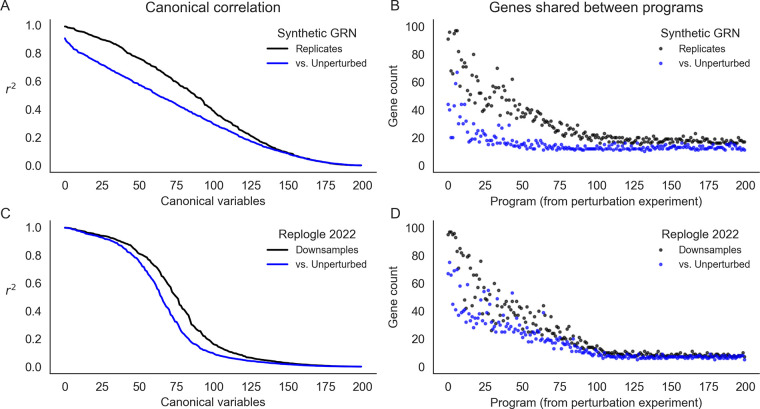
Figure 7: Learned representations are similar between control and intervened-upon cells.
Concordance between low-rank representations of single cells in a simulated GRN (top row) and downsamples of experimental data (Replogle et. al., 2022). (A) Correlation between the first 200 canonical variables (linear combinations of singular vectors) between samples of 75,328 baseline or baseline+perturbed cells from a synthetic GRN. (B) Overlap in gene programs inferred from singular value decomposition of single cell expression data. Programs are defined using singular vectors of gene expression from perturbed cells (x-axis), and intersected with programs analogously defined from baseline and additional perturbed cells. (C) Canonical correlation of control cells and two downsamples of the entire Perturb-seq experiment (Replogle et. al., 2022). (D) Overlap in gene programs computed from control and downsamples of experimental Perturb-seq data.

