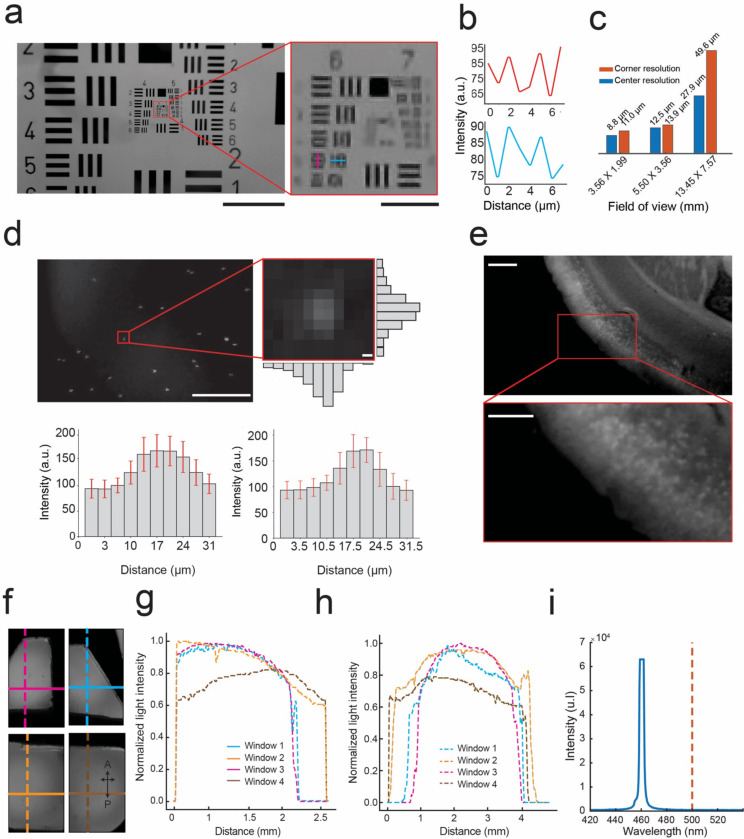
Figure 2: Optical performance of mini-MCAM:
(a) Left: Image of the #58–198 Edmund optics USAF resolution test target captured by a camera in the mini-MCAM. Red square outlining group 6 and 7 elements. Scale bar indicates 1 mm. Right: Zoomed in view of group 6 and 7 elements from the image shown on the left. The magenta and cyan lines indicate the smallest elements that can be distinguished. Scale bar indicates 100 μm.
(b) The intensity profiles measured across the magenta and cyan lines in the image shown in a. right.
(c) A bar graph plot of center and corner resolutions as a function of image FOVs achieved at different focal lengths.
(d) Image of 2μm fluorescent beads suspended in aqueous medium captured by a camera in the mini-MCAM. Scale bar indicates 2 mm. Right inset: light intensity variation across a single fluorescent bead. Bar graphs indicate the mean vertical and horizontal intensity variation (error bars show 1 standard deviation) across all microbeads in the field of view. Scale bar indicates 2 μm.
(e) An image of a 400μm thick coronal brain slice from a Cux2-CRE-ERT2. x Ai162(TIT2L-GC6s-ICL-tTA2 mouse captured using the mini-MCAM camera; inset: zoomed in view of a small section showing individual cell bodies in layers 2/3 of the brain slice. Scale Bar indicates 2 mm.
(f) Image of fluorescein dye infused agar phantom captured by the mini-MCAM through the multiplanar faceted cranial window. The colored lines indicate both vertical and horizontal sections along which the light intensity profiles were obtained.
(g) Illumination profile measured across each horizontal section indicated in figure f.
(h) Illumination profile measured across each vertical section indicated in figure f.
(i) Light power spectrum for the blue excitation light source which shows peak power cut off below 500 nm.

