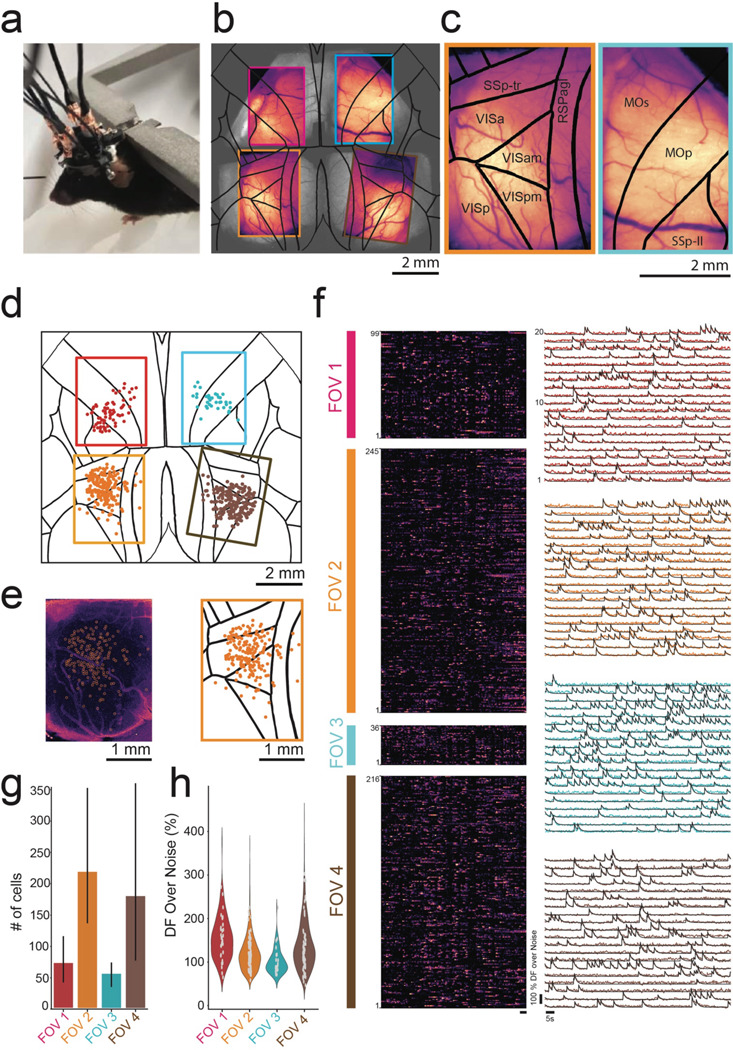
Figure 3: In vivo headfixed imaging using mini-MCAM:

(a) Photograph of a head fixed mouse with attached mini-MCAM.
(b) Maximum intensity projection (MIP) images from videos captured from the four cameras in the mini-MCAM overlaid over anatomically identical regions of the cortex in a widefield image captured from the same mouse.
(c) Zoomed in view of the MIP images from the bottom left (orange outline), and top left (cyan outline) with the Allen CCF map overlaid. Abbreviations SSp-tr- primary somatosensory area-trunk, RSPagl - retrosplenial area agranular, VIS-Visual area (a- anterior, am- anteromedial, p-primary, pm- primary medial), MOs-secondary motor area, MOp- primary motor area, SSp-II - primary somatosensory lower limb.
(d) Spatial coordinates of all cells with DFF > 20% recorded during spontaneous behavior in a head fixed mouse overlaid on the Allen CCF. Circles are color coded based on FOV they were recorded in.
(e) Left: Background subtracted MIP image from the bottom right micro-camera shown in (b). white circles indicate detect cells shown in (d). Right: Zoomed in view of the same window from (d).
(f) Left: Pseudo color normalized intensity plots of all cells recorded from each of the four FOVs indicated in (d). Scale bar indicates 5 seconds. Right: Raw DFF traces of 20 randomly selected cells in each FOV.
(g) Bar plot of number of cells recorded in each FOV (n = 3 mice).
(h) Violin plot of Average peak DFF measured in cells recorded in each FOV (n =3 mice).
